Immigrants from Portugal vs Argentinean Householder Income Ages 25 - 44 years
COMPARE
Immigrants from Portugal
Argentinean
Householder Income Ages 25 - 44 years
Householder Income Ages 25 - 44 years Comparison
Immigrants from Portugal
Argentineans
$95,512
HOUSEHOLDER INCOME AGES 25 - 44 YEARS
62.8/ 100
METRIC RATING
161st/ 347
METRIC RANK
$103,111
HOUSEHOLDER INCOME AGES 25 - 44 YEARS
99.1/ 100
METRIC RATING
83rd/ 347
METRIC RANK
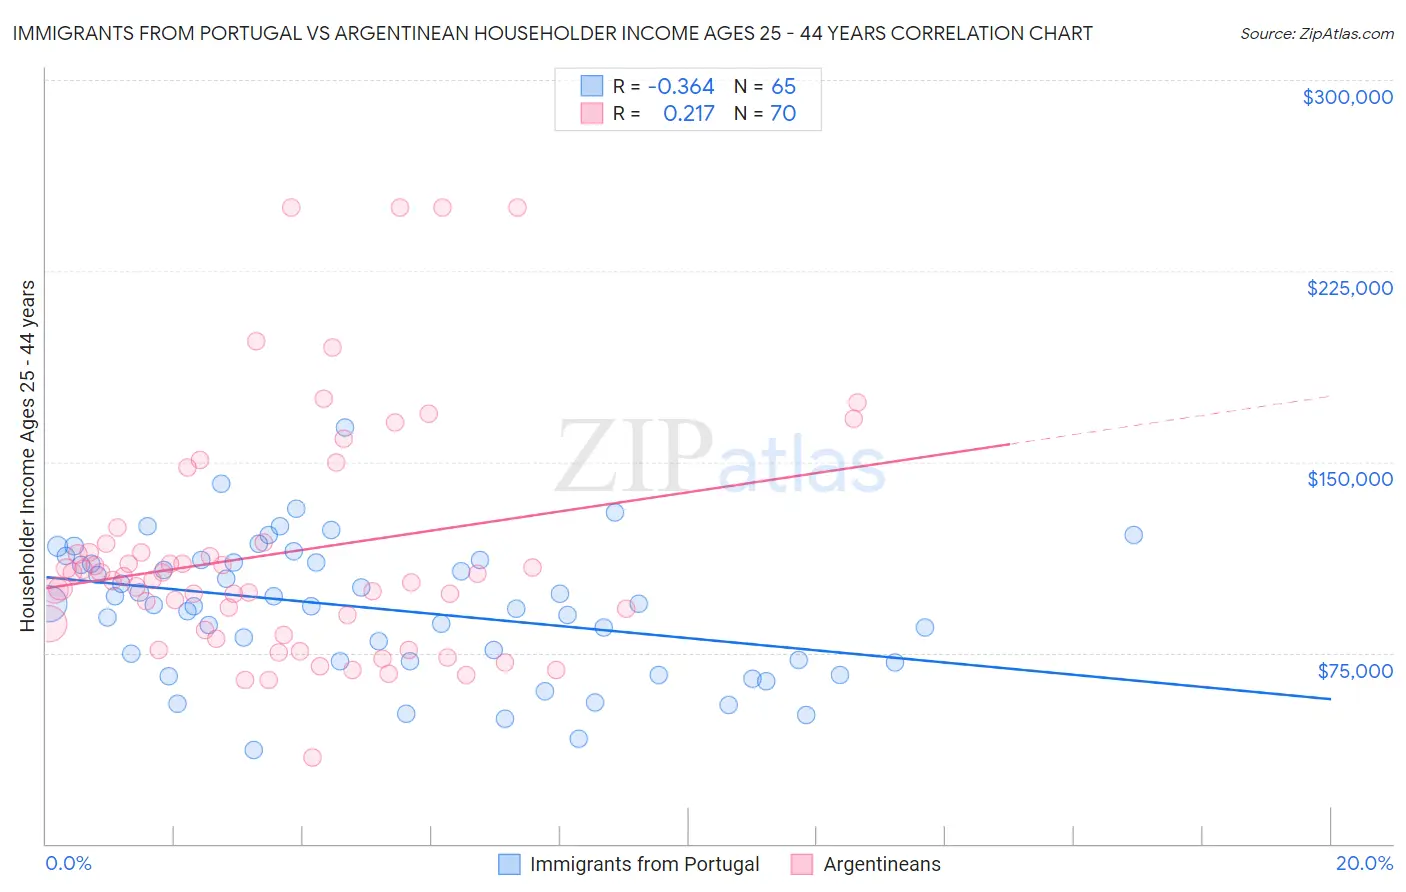
Immigrants from Portugal vs Argentinean Householder Income Ages 25 - 44 years Correlation Chart
The statistical analysis conducted on geographies consisting of 174,576,361 people shows a mild negative correlation between the proportion of Immigrants from Portugal and household income with householder between the ages 25 and 44 in the United States with a correlation coefficient (R) of -0.364 and weighted average of $95,512. Similarly, the statistical analysis conducted on geographies consisting of 296,719,437 people shows a weak positive correlation between the proportion of Argentineans and household income with householder between the ages 25 and 44 in the United States with a correlation coefficient (R) of 0.217 and weighted average of $103,111, a difference of 8.0%.
Householder Income Ages 25 - 44 years Correlation Summary
| Measurement | Immigrants from Portugal | Argentinean |
| Minimum | $36,913 | $33,750 |
| Maximum | $163,387 | $250,001 |
| Range | $126,474 | $216,251 |
| Mean | $92,248 | $114,200 |
| Median | $93,647 | $104,423 |
| Interquartile 25% (IQ1) | $71,683 | $84,111 |
| Interquartile 75% (IQ3) | $111,037 | $117,920 |
| Interquartile Range (IQR) | $39,354 | $33,809 |
| Standard Deviation (Sample) | $26,108 | $46,765 |
| Standard Deviation (Population) | $25,907 | $46,430 |
Similar Demographics by Householder Income Ages 25 - 44 years
Demographics Similar to Immigrants from Portugal by Householder Income Ages 25 - 44 years
In terms of householder income ages 25 - 44 years, the demographic groups most similar to Immigrants from Portugal are Swiss ($95,511, a difference of 0.0%), Icelander ($95,560, a difference of 0.050%), Costa Rican ($95,565, a difference of 0.060%), Immigrants from Saudi Arabia ($95,450, a difference of 0.070%), and Scandinavian ($95,596, a difference of 0.090%).
| Demographics | Rating | Rank | Householder Income Ages 25 - 44 years |
| Slavs | 73.2 /100 | #154 | Good $96,377 |
| Moroccans | 70.3 /100 | #155 | Good $96,117 |
| Immigrants | Germany | 67.9 /100 | #156 | Good $95,913 |
| Immigrants | Uganda | 65.2 /100 | #157 | Good $95,698 |
| Scandinavians | 63.9 /100 | #158 | Good $95,596 |
| Costa Ricans | 63.5 /100 | #159 | Good $95,565 |
| Icelanders | 63.4 /100 | #160 | Good $95,560 |
| Immigrants | Portugal | 62.8 /100 | #161 | Good $95,512 |
| Swiss | 62.8 /100 | #162 | Good $95,511 |
| Immigrants | Saudi Arabia | 62.0 /100 | #163 | Good $95,450 |
| South Americans | 60.9 /100 | #164 | Good $95,362 |
| Immigrants | Nepal | 60.3 /100 | #165 | Good $95,322 |
| Immigrants | Ethiopia | 59.5 /100 | #166 | Average $95,256 |
| Czechoslovakians | 57.0 /100 | #167 | Average $95,070 |
| Alsatians | 56.8 /100 | #168 | Average $95,059 |
Demographics Similar to Argentineans by Householder Income Ages 25 - 44 years
In terms of householder income ages 25 - 44 years, the demographic groups most similar to Argentineans are Immigrants from Serbia ($103,155, a difference of 0.040%), South African ($103,160, a difference of 0.050%), Immigrants from Egypt ($103,192, a difference of 0.080%), Armenian ($103,248, a difference of 0.13%), and Immigrants from Philippines ($102,910, a difference of 0.20%).
| Demographics | Rating | Rank | Householder Income Ages 25 - 44 years |
| Immigrants | Spain | 99.4 /100 | #76 | Exceptional $103,752 |
| Immigrants | Southern Europe | 99.3 /100 | #77 | Exceptional $103,486 |
| Immigrants | Bulgaria | 99.3 /100 | #78 | Exceptional $103,423 |
| Armenians | 99.2 /100 | #79 | Exceptional $103,248 |
| Immigrants | Egypt | 99.2 /100 | #80 | Exceptional $103,192 |
| South Africans | 99.2 /100 | #81 | Exceptional $103,160 |
| Immigrants | Serbia | 99.2 /100 | #82 | Exceptional $103,155 |
| Argentineans | 99.1 /100 | #83 | Exceptional $103,111 |
| Immigrants | Philippines | 99.0 /100 | #84 | Exceptional $102,910 |
| Immigrants | Ukraine | 98.9 /100 | #85 | Exceptional $102,664 |
| Immigrants | Hungary | 98.9 /100 | #86 | Exceptional $102,655 |
| Immigrants | Western Europe | 98.9 /100 | #87 | Exceptional $102,654 |
| Immigrants | Canada | 98.9 /100 | #88 | Exceptional $102,616 |
| Romanians | 98.8 /100 | #89 | Exceptional $102,544 |
| Ukrainians | 98.8 /100 | #90 | Exceptional $102,451 |