French Canadian vs Argentinean Householder Income Ages 25 - 44 years
COMPARE
French Canadian
Argentinean
Householder Income Ages 25 - 44 years
Householder Income Ages 25 - 44 years Comparison
French Canadians
Argentineans
$93,694
HOUSEHOLDER INCOME AGES 25 - 44 YEARS
38.2/ 100
METRIC RATING
179th/ 347
METRIC RANK
$103,111
HOUSEHOLDER INCOME AGES 25 - 44 YEARS
99.1/ 100
METRIC RATING
83rd/ 347
METRIC RANK
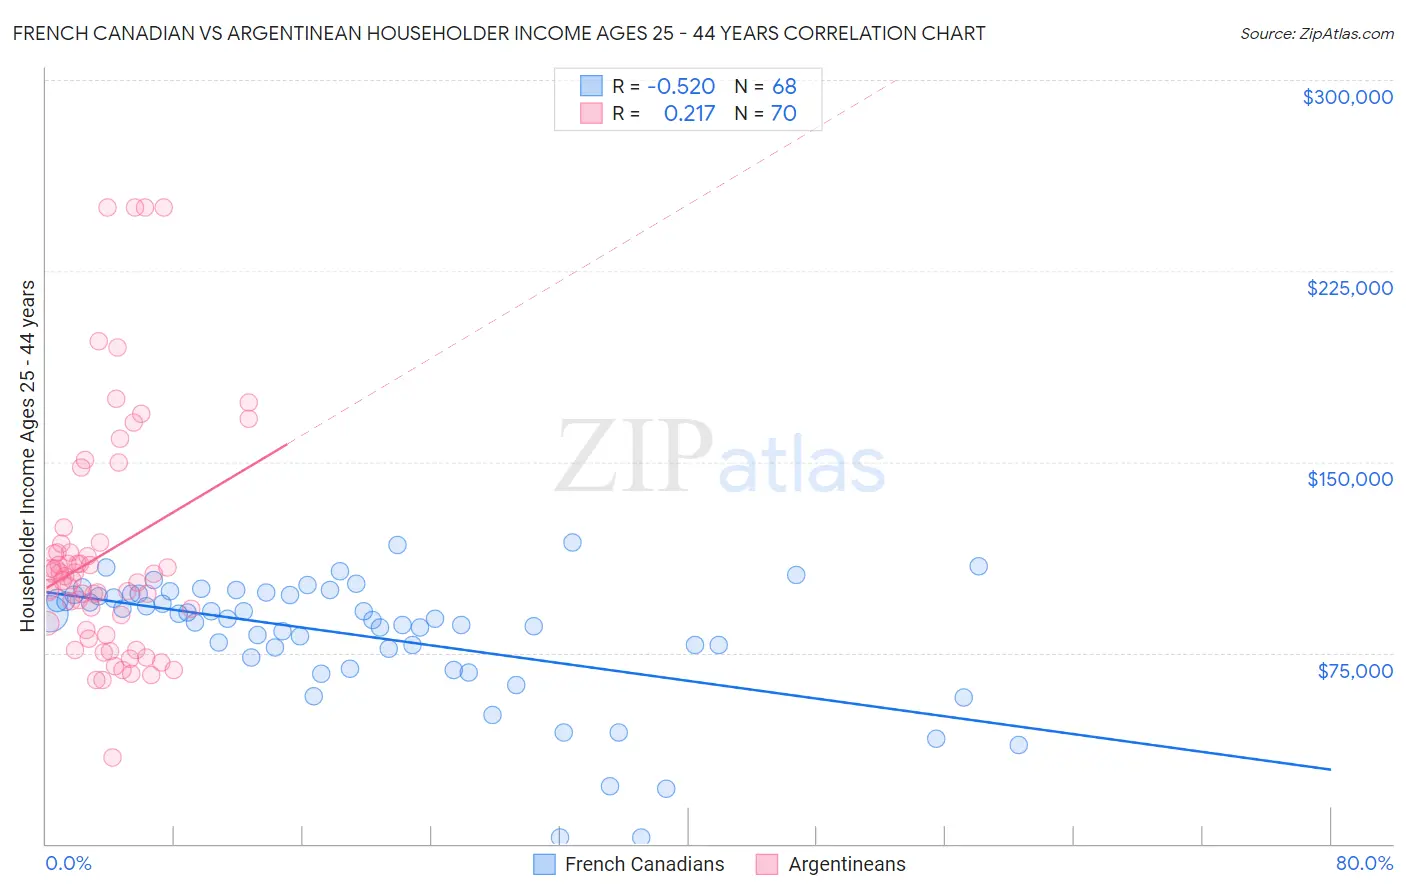
French Canadian vs Argentinean Householder Income Ages 25 - 44 years Correlation Chart
The statistical analysis conducted on geographies consisting of 499,836,876 people shows a substantial negative correlation between the proportion of French Canadians and household income with householder between the ages 25 and 44 in the United States with a correlation coefficient (R) of -0.520 and weighted average of $93,694. Similarly, the statistical analysis conducted on geographies consisting of 296,719,437 people shows a weak positive correlation between the proportion of Argentineans and household income with householder between the ages 25 and 44 in the United States with a correlation coefficient (R) of 0.217 and weighted average of $103,111, a difference of 10.1%.
Householder Income Ages 25 - 44 years Correlation Summary
| Measurement | French Canadian | Argentinean |
| Minimum | $2,499 | $33,750 |
| Maximum | $118,309 | $250,001 |
| Range | $115,810 | $216,251 |
| Mean | $81,603 | $114,200 |
| Median | $88,389 | $104,423 |
| Interquartile 25% (IQ1) | $74,933 | $84,111 |
| Interquartile 75% (IQ3) | $98,053 | $117,920 |
| Interquartile Range (IQR) | $23,120 | $33,809 |
| Standard Deviation (Sample) | $24,791 | $46,765 |
| Standard Deviation (Population) | $24,608 | $46,430 |
Similar Demographics by Householder Income Ages 25 - 44 years
Demographics Similar to French Canadians by Householder Income Ages 25 - 44 years
In terms of householder income ages 25 - 44 years, the demographic groups most similar to French Canadians are French ($93,665, a difference of 0.030%), Puget Sound Salish ($93,661, a difference of 0.040%), Uruguayan ($93,631, a difference of 0.070%), Guamanian/Chamorro ($93,569, a difference of 0.13%), and German ($93,531, a difference of 0.18%).
| Demographics | Rating | Rank | Householder Income Ages 25 - 44 years |
| Scottish | 50.8 /100 | #172 | Average $94,622 |
| Finns | 50.6 /100 | #173 | Average $94,610 |
| Colombians | 50.0 /100 | #174 | Average $94,565 |
| English | 48.1 /100 | #175 | Average $94,429 |
| Immigrants | Immigrants | 48.0 /100 | #176 | Average $94,423 |
| Belgians | 45.8 /100 | #177 | Average $94,262 |
| Immigrants | South America | 42.8 /100 | #178 | Average $94,042 |
| French Canadians | 38.2 /100 | #179 | Fair $93,694 |
| French | 37.8 /100 | #180 | Fair $93,665 |
| Puget Sound Salish | 37.7 /100 | #181 | Fair $93,661 |
| Uruguayans | 37.3 /100 | #182 | Fair $93,631 |
| Guamanians/Chamorros | 36.5 /100 | #183 | Fair $93,569 |
| Germans | 36.0 /100 | #184 | Fair $93,531 |
| Immigrants | Eritrea | 35.2 /100 | #185 | Fair $93,466 |
| Sierra Leoneans | 34.8 /100 | #186 | Fair $93,435 |
Demographics Similar to Argentineans by Householder Income Ages 25 - 44 years
In terms of householder income ages 25 - 44 years, the demographic groups most similar to Argentineans are Immigrants from Serbia ($103,155, a difference of 0.040%), South African ($103,160, a difference of 0.050%), Immigrants from Egypt ($103,192, a difference of 0.080%), Armenian ($103,248, a difference of 0.13%), and Immigrants from Philippines ($102,910, a difference of 0.20%).
| Demographics | Rating | Rank | Householder Income Ages 25 - 44 years |
| Immigrants | Spain | 99.4 /100 | #76 | Exceptional $103,752 |
| Immigrants | Southern Europe | 99.3 /100 | #77 | Exceptional $103,486 |
| Immigrants | Bulgaria | 99.3 /100 | #78 | Exceptional $103,423 |
| Armenians | 99.2 /100 | #79 | Exceptional $103,248 |
| Immigrants | Egypt | 99.2 /100 | #80 | Exceptional $103,192 |
| South Africans | 99.2 /100 | #81 | Exceptional $103,160 |
| Immigrants | Serbia | 99.2 /100 | #82 | Exceptional $103,155 |
| Argentineans | 99.1 /100 | #83 | Exceptional $103,111 |
| Immigrants | Philippines | 99.0 /100 | #84 | Exceptional $102,910 |
| Immigrants | Ukraine | 98.9 /100 | #85 | Exceptional $102,664 |
| Immigrants | Hungary | 98.9 /100 | #86 | Exceptional $102,655 |
| Immigrants | Western Europe | 98.9 /100 | #87 | Exceptional $102,654 |
| Immigrants | Canada | 98.9 /100 | #88 | Exceptional $102,616 |
| Romanians | 98.8 /100 | #89 | Exceptional $102,544 |
| Ukrainians | 98.8 /100 | #90 | Exceptional $102,451 |