Alaskan Athabascan vs Ugandan Disability Age Over 75
COMPARE
Alaskan Athabascan
Ugandan
Disability Age Over 75
Disability Age Over 75 Comparison
Alaskan Athabascans
Ugandans
54.0%
DISABILITY AGE OVER 75
0.0/ 100
METRIC RATING
334th/ 347
METRIC RANK
46.3%
DISABILITY AGE OVER 75
98.2/ 100
METRIC RATING
93rd/ 347
METRIC RANK
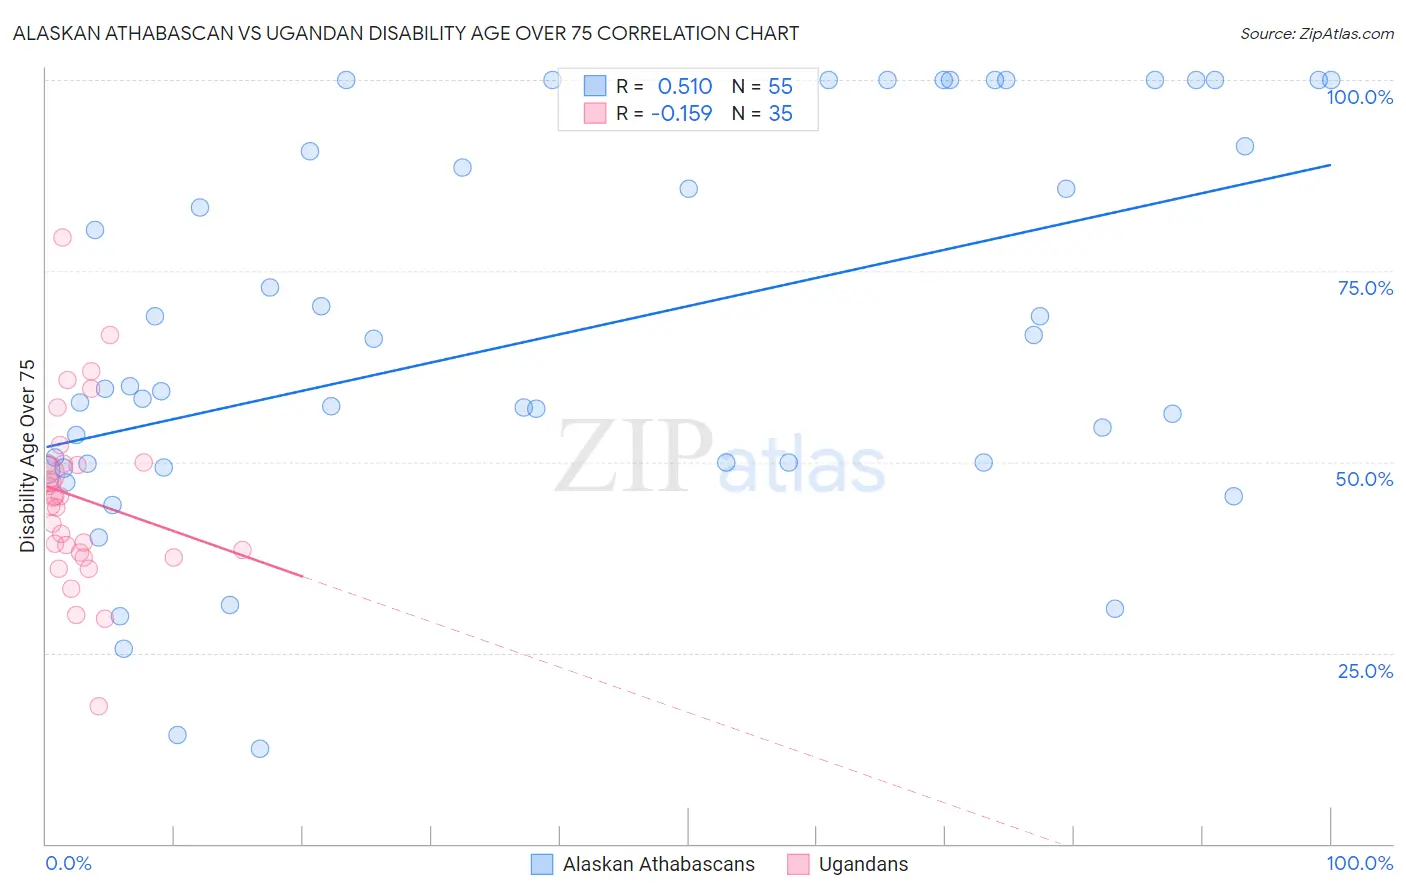
Alaskan Athabascan vs Ugandan Disability Age Over 75 Correlation Chart
The statistical analysis conducted on geographies consisting of 45,799,271 people shows a substantial positive correlation between the proportion of Alaskan Athabascans and percentage of population with a disability over the age of 75 in the United States with a correlation coefficient (R) of 0.510 and weighted average of 54.0%. Similarly, the statistical analysis conducted on geographies consisting of 93,983,059 people shows a poor negative correlation between the proportion of Ugandans and percentage of population with a disability over the age of 75 in the United States with a correlation coefficient (R) of -0.159 and weighted average of 46.3%, a difference of 16.6%.
Disability Age Over 75 Correlation Summary
| Measurement | Alaskan Athabascan | Ugandan |
| Minimum | 12.5% | 17.9% |
| Maximum | 100.0% | 79.3% |
| Range | 87.5% | 61.4% |
| Mean | 66.7% | 45.3% |
| Median | 59.6% | 45.3% |
| Interquartile 25% (IQ1) | 49.8% | 38.1% |
| Interquartile 75% (IQ3) | 91.3% | 49.8% |
| Interquartile Range (IQR) | 41.5% | 11.7% |
| Standard Deviation (Sample) | 25.1% | 11.6% |
| Standard Deviation (Population) | 24.8% | 11.4% |
Similar Demographics by Disability Age Over 75
Demographics Similar to Alaskan Athabascans by Disability Age Over 75
In terms of disability age over 75, the demographic groups most similar to Alaskan Athabascans are Kiowa (54.2%, a difference of 0.53%), Apache (53.6%, a difference of 0.67%), Immigrants from Armenia (54.3%, a difference of 0.69%), Yuman (54.4%, a difference of 0.85%), and Native/Alaskan (53.1%, a difference of 1.7%).
| Demographics | Rating | Rank | Disability Age Over 75 |
| Nepalese | 0.0 /100 | #327 | Tragic 52.6% |
| Choctaw | 0.0 /100 | #328 | Tragic 52.7% |
| Alaska Natives | 0.0 /100 | #329 | Tragic 52.8% |
| Puerto Ricans | 0.0 /100 | #330 | Tragic 52.9% |
| Hopi | 0.0 /100 | #331 | Tragic 52.9% |
| Natives/Alaskans | 0.0 /100 | #332 | Tragic 53.1% |
| Apache | 0.0 /100 | #333 | Tragic 53.6% |
| Alaskan Athabascans | 0.0 /100 | #334 | Tragic 54.0% |
| Kiowa | 0.0 /100 | #335 | Tragic 54.2% |
| Immigrants | Armenia | 0.0 /100 | #336 | Tragic 54.3% |
| Yuman | 0.0 /100 | #337 | Tragic 54.4% |
| Colville | 0.0 /100 | #338 | Tragic 55.4% |
| Pima | 0.0 /100 | #339 | Tragic 55.8% |
| Pueblo | 0.0 /100 | #340 | Tragic 55.9% |
| Houma | 0.0 /100 | #341 | Tragic 56.2% |
Demographics Similar to Ugandans by Disability Age Over 75
In terms of disability age over 75, the demographic groups most similar to Ugandans are German (46.3%, a difference of 0.0%), Albanian (46.3%, a difference of 0.030%), Immigrants from Egypt (46.3%, a difference of 0.050%), Northern European (46.3%, a difference of 0.060%), and Immigrants from Brazil (46.3%, a difference of 0.060%).
| Demographics | Rating | Rank | Disability Age Over 75 |
| Romanians | 98.6 /100 | #86 | Exceptional 46.2% |
| Danes | 98.6 /100 | #87 | Exceptional 46.2% |
| Uruguayans | 98.4 /100 | #88 | Exceptional 46.2% |
| Immigrants | Saudi Arabia | 98.4 /100 | #89 | Exceptional 46.3% |
| Northern Europeans | 98.3 /100 | #90 | Exceptional 46.3% |
| Immigrants | Egypt | 98.3 /100 | #91 | Exceptional 46.3% |
| Germans | 98.2 /100 | #92 | Exceptional 46.3% |
| Ugandans | 98.2 /100 | #93 | Exceptional 46.3% |
| Albanians | 98.1 /100 | #94 | Exceptional 46.3% |
| Immigrants | Brazil | 98.0 /100 | #95 | Exceptional 46.3% |
| Immigrants | China | 98.0 /100 | #96 | Exceptional 46.3% |
| Finns | 97.9 /100 | #97 | Exceptional 46.3% |
| Immigrants | Japan | 97.8 /100 | #98 | Exceptional 46.3% |
| Palestinians | 97.7 /100 | #99 | Exceptional 46.3% |
| Immigrants | Eastern Europe | 97.7 /100 | #100 | Exceptional 46.3% |