Zip Codes with the Highest Percentage of Population Employed in Legal Services & Support in Iowa City, IA
RELATED REPORTS & OPTIONS
Legal Services & Support
Iowa City
Compare Zip Codes
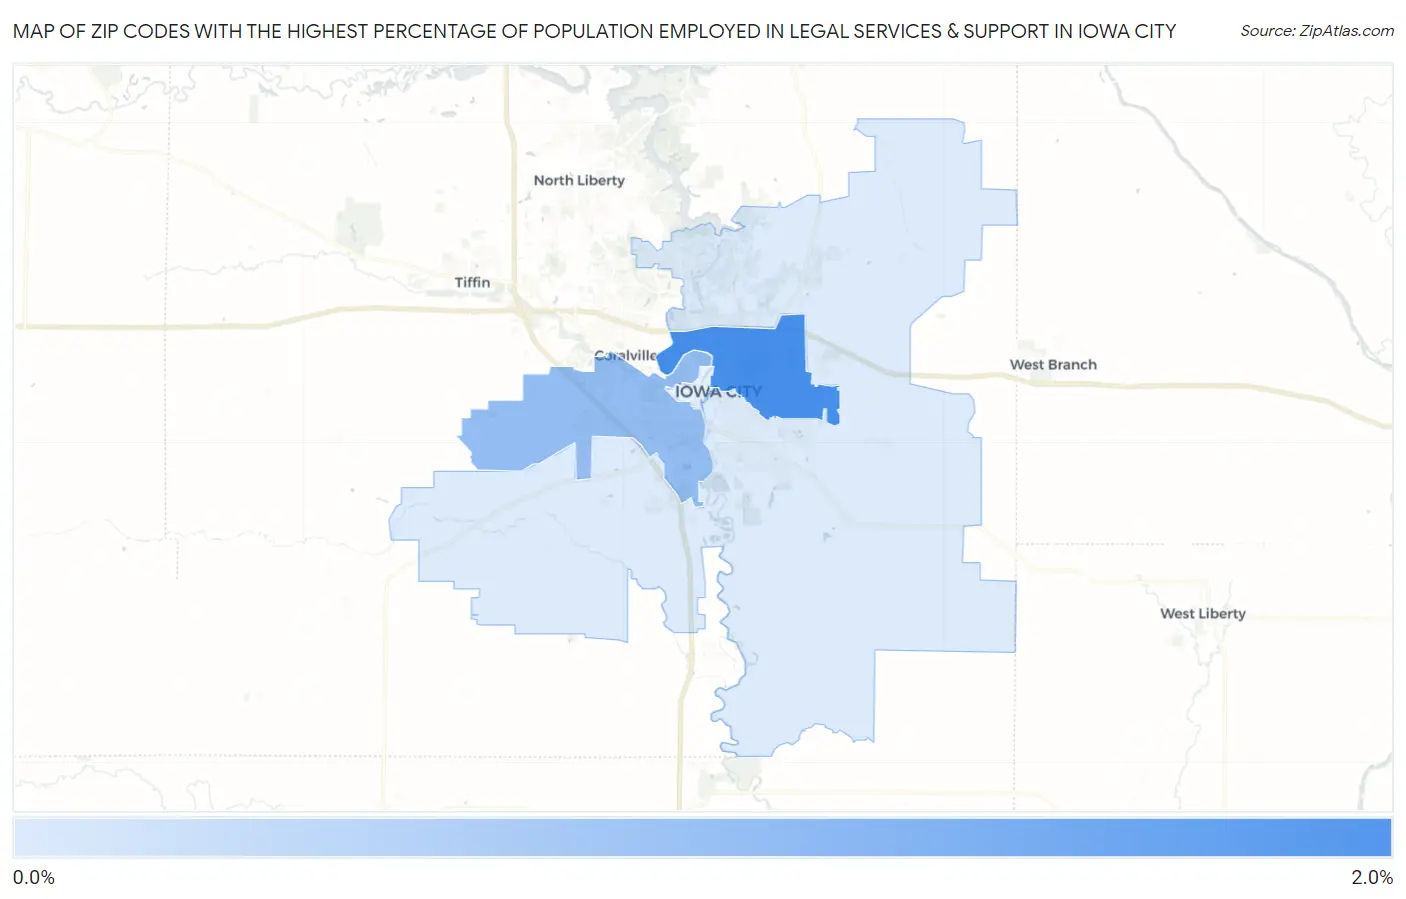
Map of Zip Codes with the Highest Percentage of Population Employed in Legal Services & Support in Iowa City
0.55%
1.6%
Zip Codes with the Highest Percentage of Population Employed in Legal Services & Support in Iowa City, IA
| Zip Code | % Employed | vs State | vs National | |
| 1. | 52245 | 1.6% | 0.75%(+0.863)#67 | 1.2%(+0.425)#4,647 |
| 2. | 52246 | 1.1% | 0.75%(+0.332)#114 | 1.2%(-0.106)#7,322 |
| 3. | 52240 | 0.55% | 0.75%(-0.191)#219 | 1.2%(-0.629)#12,007 |
1
Common Questions
What are the Top 3 Zip Codes with the Highest Percentage of Population Employed in Legal Services & Support in Iowa City, IA?
Top 3 Zip Codes with the Highest Percentage of Population Employed in Legal Services & Support in Iowa City, IA are:
What zip code has the Highest Percentage of Population Employed in Legal Services & Support in Iowa City, IA?
52245 has the Highest Percentage of Population Employed in Legal Services & Support in Iowa City, IA with 1.6%.
What is the Percentage of Population Employed in Legal Services & Support in Iowa City, IA?
Percentage of Population Employed in Legal Services & Support in Iowa City is 0.86%.
What is the Percentage of Population Employed in Legal Services & Support in Iowa?
Percentage of Population Employed in Legal Services & Support in Iowa is 0.75%.
What is the Percentage of Population Employed in Legal Services & Support in the United States?
Percentage of Population Employed in Legal Services & Support in the United States is 1.2%.