Portuguese vs Immigrants from Belize Single Father Households
COMPARE
Portuguese
Immigrants from Belize
Single Father Households
Single Father Households Comparison
Portuguese
Immigrants from Belize
2.5%
SINGLE FATHER HOUSEHOLDS
4.1/ 100
METRIC RATING
241st/ 347
METRIC RANK
2.5%
SINGLE FATHER HOUSEHOLDS
0.9/ 100
METRIC RATING
261st/ 347
METRIC RANK
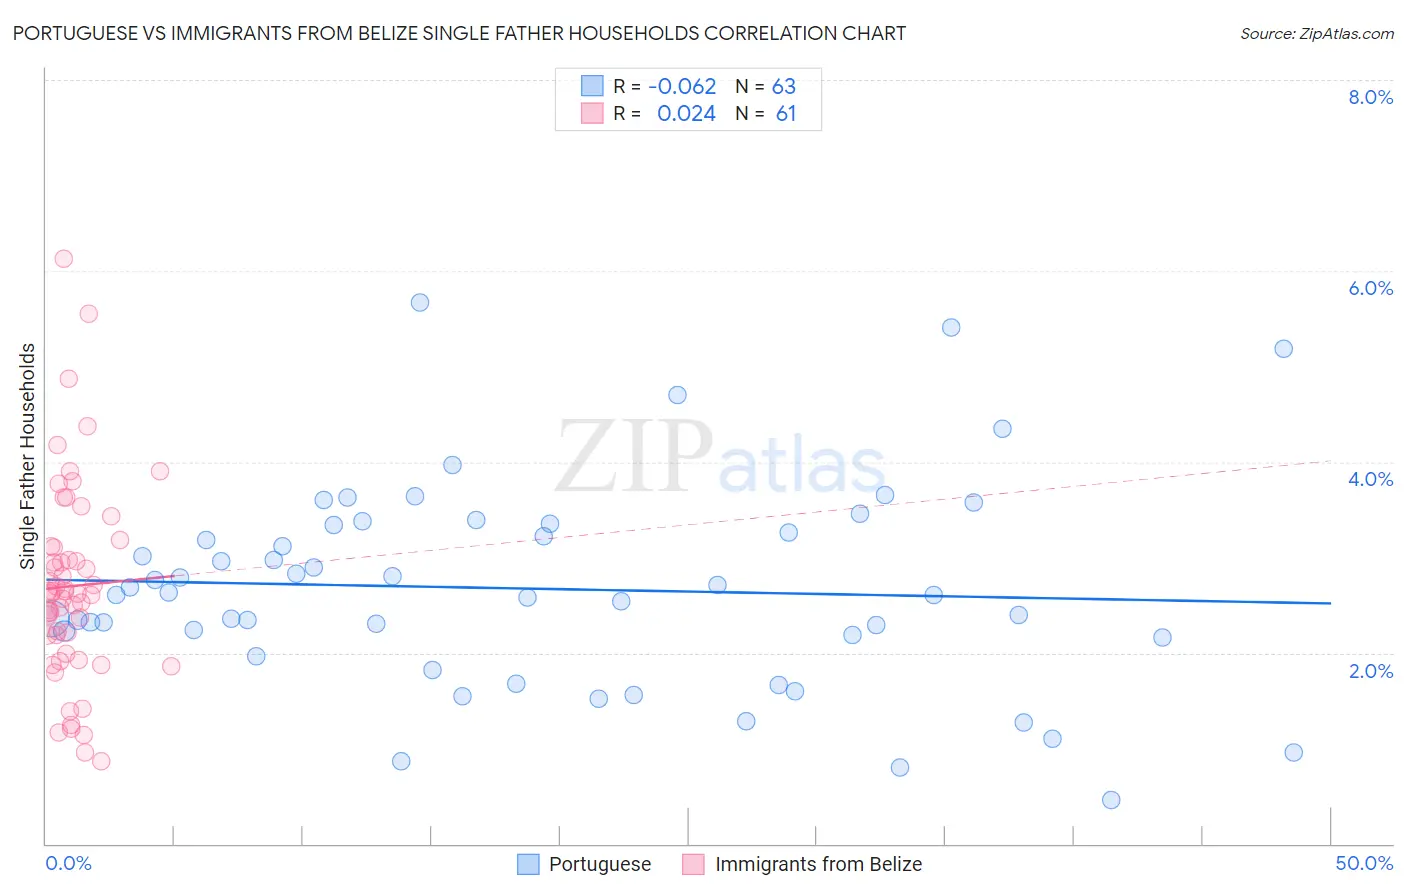
Portuguese vs Immigrants from Belize Single Father Households Correlation Chart
The statistical analysis conducted on geographies consisting of 444,369,792 people shows a slight negative correlation between the proportion of Portuguese and percentage of single father households in the United States with a correlation coefficient (R) of -0.062 and weighted average of 2.5%. Similarly, the statistical analysis conducted on geographies consisting of 129,846,095 people shows no correlation between the proportion of Immigrants from Belize and percentage of single father households in the United States with a correlation coefficient (R) of 0.024 and weighted average of 2.5%, a difference of 2.7%.
Single Father Households Correlation Summary
| Measurement | Portuguese | Immigrants from Belize |
| Minimum | 0.46% | 0.87% |
| Maximum | 5.7% | 6.1% |
| Range | 5.2% | 5.3% |
| Mean | 2.7% | 2.7% |
| Median | 2.6% | 2.6% |
| Interquartile 25% (IQ1) | 2.2% | 2.1% |
| Interquartile 75% (IQ3) | 3.3% | 3.1% |
| Interquartile Range (IQR) | 1.2% | 1.0% |
| Standard Deviation (Sample) | 1.1% | 1.0% |
| Standard Deviation (Population) | 1.1% | 1.0% |
Demographics Similar to Portuguese and Immigrants from Belize by Single Father Households
In terms of single father households, the demographic groups most similar to Portuguese are Osage (2.5%, a difference of 0.030%), Spaniard (2.5%, a difference of 0.50%), Immigrants from Middle Africa (2.5%, a difference of 0.68%), Basque (2.5%, a difference of 0.89%), and Native Hawaiian (2.5%, a difference of 0.91%). Similarly, the demographic groups most similar to Immigrants from Belize are Immigrants from Caribbean (2.5%, a difference of 0.16%), Comanche (2.5%, a difference of 0.25%), Spanish (2.5%, a difference of 0.40%), Immigrants from Congo (2.5%, a difference of 0.49%), and Potawatomi (2.5%, a difference of 0.78%).
| Demographics | Rating | Rank | Single Father Households |
| Portuguese | 4.1 /100 | #241 | Tragic 2.5% |
| Osage | 4.1 /100 | #242 | Tragic 2.5% |
| Spaniards | 3.1 /100 | #243 | Tragic 2.5% |
| Immigrants | Middle Africa | 2.8 /100 | #244 | Tragic 2.5% |
| Basques | 2.5 /100 | #245 | Tragic 2.5% |
| Native Hawaiians | 2.5 /100 | #246 | Tragic 2.5% |
| Delaware | 2.5 /100 | #247 | Tragic 2.5% |
| Bahamians | 2.4 /100 | #248 | Tragic 2.5% |
| Immigrants | Cameroon | 2.3 /100 | #249 | Tragic 2.5% |
| Somalis | 2.1 /100 | #250 | Tragic 2.5% |
| Liberians | 2.0 /100 | #251 | Tragic 2.5% |
| Immigrants | Eritrea | 2.0 /100 | #252 | Tragic 2.5% |
| Immigrants | Somalia | 1.9 /100 | #253 | Tragic 2.5% |
| Immigrants | Thailand | 1.8 /100 | #254 | Tragic 2.5% |
| Tongans | 1.5 /100 | #255 | Tragic 2.5% |
| Potawatomi | 1.4 /100 | #256 | Tragic 2.5% |
| Immigrants | Congo | 1.2 /100 | #257 | Tragic 2.5% |
| Spanish | 1.1 /100 | #258 | Tragic 2.5% |
| Comanche | 1.0 /100 | #259 | Tragic 2.5% |
| Immigrants | Caribbean | 1.0 /100 | #260 | Tragic 2.5% |
| Immigrants | Belize | 0.9 /100 | #261 | Tragic 2.5% |