Yuman vs Bermudan Family Households with Children
COMPARE
Yuman
Bermudan
Family Households with Children
Family Households with Children Comparison
Yuman
Bermudans
29.5%
FAMILY HOUSEHOLDS WITH CHILDREN
100.0/ 100
METRIC RATING
30th/ 347
METRIC RANK
26.3%
FAMILY HOUSEHOLDS WITH CHILDREN
0.1/ 100
METRIC RATING
306th/ 347
METRIC RANK
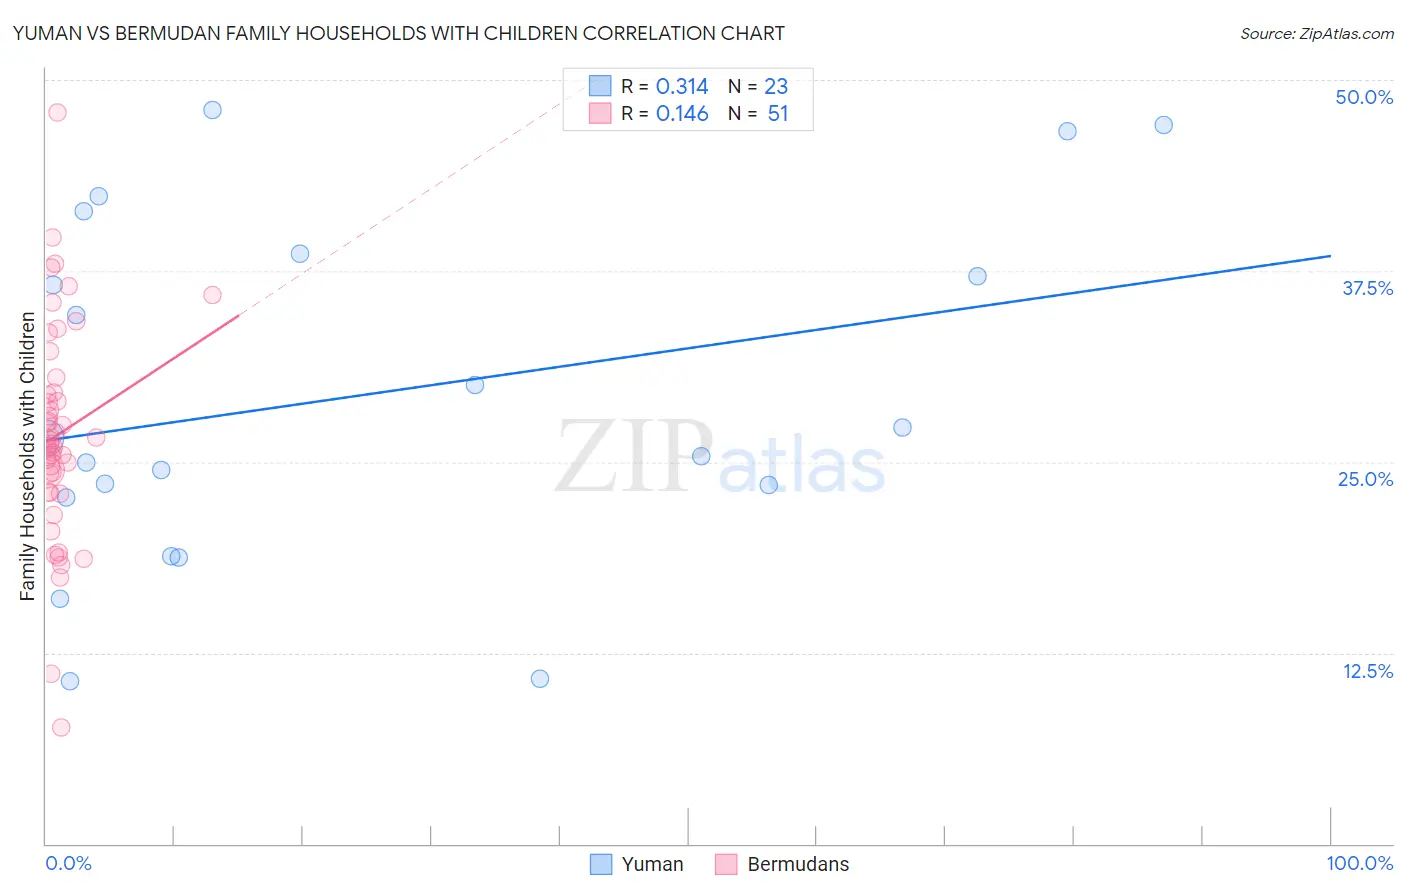
Yuman vs Bermudan Family Households with Children Correlation Chart
The statistical analysis conducted on geographies consisting of 40,663,391 people shows a mild positive correlation between the proportion of Yuman and percentage of family households with children in the United States with a correlation coefficient (R) of 0.314 and weighted average of 29.5%. Similarly, the statistical analysis conducted on geographies consisting of 55,716,155 people shows a poor positive correlation between the proportion of Bermudans and percentage of family households with children in the United States with a correlation coefficient (R) of 0.146 and weighted average of 26.3%, a difference of 12.0%.
Family Households with Children Correlation Summary
| Measurement | Yuman | Bermudan |
| Minimum | 10.6% | 7.6% |
| Maximum | 48.0% | 47.9% |
| Range | 37.4% | 40.3% |
| Mean | 29.4% | 26.8% |
| Median | 26.6% | 26.2% |
| Interquartile 25% (IQ1) | 22.6% | 23.0% |
| Interquartile 75% (IQ3) | 38.6% | 29.6% |
| Interquartile Range (IQR) | 16.0% | 6.5% |
| Standard Deviation (Sample) | 11.2% | 7.1% |
| Standard Deviation (Population) | 11.0% | 7.0% |
Similar Demographics by Family Households with Children
Demographics Similar to Yuman by Family Households with Children
In terms of family households with children, the demographic groups most similar to Yuman are Bolivian (29.5%, a difference of 0.030%), Samoan (29.5%, a difference of 0.040%), Japanese (29.4%, a difference of 0.14%), Immigrants from Vietnam (29.5%, a difference of 0.19%), and Immigrants from Yemen (29.4%, a difference of 0.20%).
| Demographics | Rating | Rank | Family Households with Children |
| Mexican American Indians | 100.0 /100 | #23 | Exceptional 29.7% |
| Guamanians/Chamorros | 100.0 /100 | #24 | Exceptional 29.7% |
| Immigrants | Latin America | 100.0 /100 | #25 | Exceptional 29.7% |
| Sri Lankans | 100.0 /100 | #26 | Exceptional 29.5% |
| Immigrants | Vietnam | 100.0 /100 | #27 | Exceptional 29.5% |
| Samoans | 100.0 /100 | #28 | Exceptional 29.5% |
| Bolivians | 100.0 /100 | #29 | Exceptional 29.5% |
| Yuman | 100.0 /100 | #30 | Exceptional 29.5% |
| Japanese | 100.0 /100 | #31 | Exceptional 29.4% |
| Immigrants | Yemen | 100.0 /100 | #32 | Exceptional 29.4% |
| Venezuelans | 100.0 /100 | #33 | Exceptional 29.4% |
| Immigrants | Bolivia | 100.0 /100 | #34 | Exceptional 29.3% |
| Immigrants | Sierra Leone | 100.0 /100 | #35 | Exceptional 29.3% |
| Immigrants | Venezuela | 100.0 /100 | #36 | Exceptional 29.3% |
| Immigrants | Cameroon | 100.0 /100 | #37 | Exceptional 29.2% |
Demographics Similar to Bermudans by Family Households with Children
In terms of family households with children, the demographic groups most similar to Bermudans are Guyanese (26.3%, a difference of 0.010%), Immigrants from Bahamas (26.3%, a difference of 0.040%), West Indian (26.3%, a difference of 0.080%), Immigrants from Guyana (26.3%, a difference of 0.090%), and Lumbee (26.3%, a difference of 0.10%).
| Demographics | Rating | Rank | Family Households with Children |
| Trinidadians and Tobagonians | 0.1 /100 | #299 | Tragic 26.4% |
| Paiute | 0.1 /100 | #300 | Tragic 26.4% |
| Immigrants | Trinidad and Tobago | 0.1 /100 | #301 | Tragic 26.4% |
| Serbians | 0.1 /100 | #302 | Tragic 26.4% |
| Immigrants | Guyana | 0.1 /100 | #303 | Tragic 26.3% |
| Immigrants | Bahamas | 0.1 /100 | #304 | Tragic 26.3% |
| Guyanese | 0.1 /100 | #305 | Tragic 26.3% |
| Bermudans | 0.1 /100 | #306 | Tragic 26.3% |
| West Indians | 0.0 /100 | #307 | Tragic 26.3% |
| Lumbee | 0.0 /100 | #308 | Tragic 26.3% |
| Immigrants | Somalia | 0.0 /100 | #309 | Tragic 26.3% |
| Marshallese | 0.0 /100 | #310 | Tragic 26.2% |
| Colville | 0.0 /100 | #311 | Tragic 26.2% |
| Immigrants | Czechoslovakia | 0.0 /100 | #312 | Tragic 26.2% |
| Cree | 0.0 /100 | #313 | Tragic 26.2% |