Yuman vs Immigrants from Caribbean Family Households with Children
COMPARE
Yuman
Immigrants from Caribbean
Family Households with Children
Family Households with Children Comparison
Yuman
Immigrants from Caribbean
29.5%
FAMILY HOUSEHOLDS WITH CHILDREN
100.0/ 100
METRIC RATING
30th/ 347
METRIC RANK
27.0%
FAMILY HOUSEHOLDS WITH CHILDREN
6.3/ 100
METRIC RATING
229th/ 347
METRIC RANK
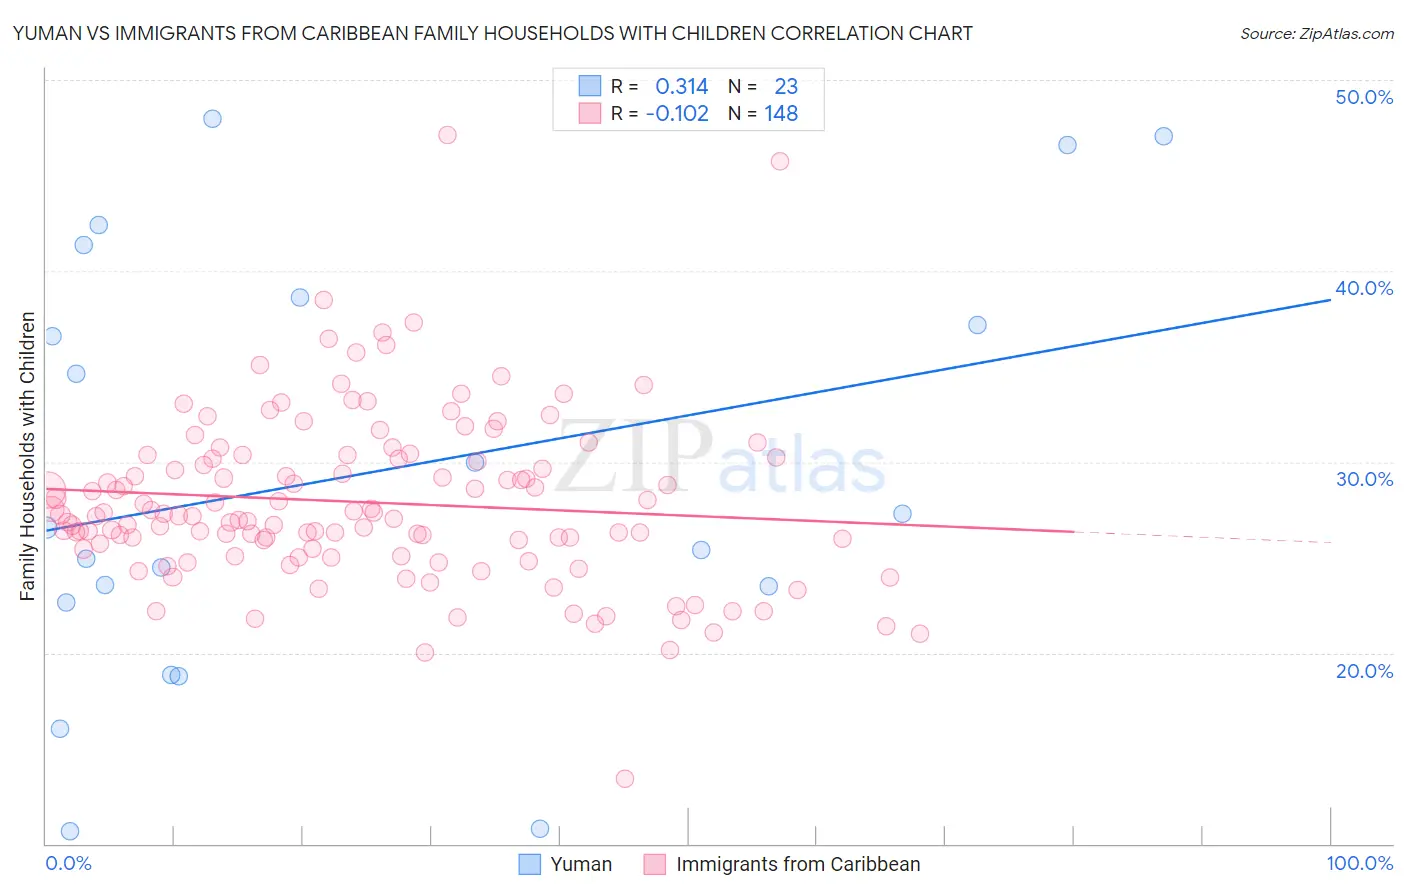
Yuman vs Immigrants from Caribbean Family Households with Children Correlation Chart
The statistical analysis conducted on geographies consisting of 40,663,391 people shows a mild positive correlation between the proportion of Yuman and percentage of family households with children in the United States with a correlation coefficient (R) of 0.314 and weighted average of 29.5%. Similarly, the statistical analysis conducted on geographies consisting of 449,473,851 people shows a poor negative correlation between the proportion of Immigrants from Caribbean and percentage of family households with children in the United States with a correlation coefficient (R) of -0.102 and weighted average of 27.0%, a difference of 9.0%.
Family Households with Children Correlation Summary
| Measurement | Yuman | Immigrants from Caribbean |
| Minimum | 10.6% | 13.4% |
| Maximum | 48.0% | 47.1% |
| Range | 37.4% | 33.7% |
| Mean | 29.4% | 27.9% |
| Median | 26.6% | 27.2% |
| Interquartile 25% (IQ1) | 22.6% | 25.4% |
| Interquartile 75% (IQ3) | 38.6% | 30.2% |
| Interquartile Range (IQR) | 16.0% | 4.8% |
| Standard Deviation (Sample) | 11.2% | 4.5% |
| Standard Deviation (Population) | 11.0% | 4.5% |
Similar Demographics by Family Households with Children
Demographics Similar to Yuman by Family Households with Children
In terms of family households with children, the demographic groups most similar to Yuman are Bolivian (29.5%, a difference of 0.030%), Samoan (29.5%, a difference of 0.040%), Japanese (29.4%, a difference of 0.14%), Immigrants from Vietnam (29.5%, a difference of 0.19%), and Immigrants from Yemen (29.4%, a difference of 0.20%).
| Demographics | Rating | Rank | Family Households with Children |
| Mexican American Indians | 100.0 /100 | #23 | Exceptional 29.7% |
| Guamanians/Chamorros | 100.0 /100 | #24 | Exceptional 29.7% |
| Immigrants | Latin America | 100.0 /100 | #25 | Exceptional 29.7% |
| Sri Lankans | 100.0 /100 | #26 | Exceptional 29.5% |
| Immigrants | Vietnam | 100.0 /100 | #27 | Exceptional 29.5% |
| Samoans | 100.0 /100 | #28 | Exceptional 29.5% |
| Bolivians | 100.0 /100 | #29 | Exceptional 29.5% |
| Yuman | 100.0 /100 | #30 | Exceptional 29.5% |
| Japanese | 100.0 /100 | #31 | Exceptional 29.4% |
| Immigrants | Yemen | 100.0 /100 | #32 | Exceptional 29.4% |
| Venezuelans | 100.0 /100 | #33 | Exceptional 29.4% |
| Immigrants | Bolivia | 100.0 /100 | #34 | Exceptional 29.3% |
| Immigrants | Sierra Leone | 100.0 /100 | #35 | Exceptional 29.3% |
| Immigrants | Venezuela | 100.0 /100 | #36 | Exceptional 29.3% |
| Immigrants | Cameroon | 100.0 /100 | #37 | Exceptional 29.2% |
Demographics Similar to Immigrants from Caribbean by Family Households with Children
In terms of family households with children, the demographic groups most similar to Immigrants from Caribbean are Czechoslovakian (27.0%, a difference of 0.030%), Tsimshian (27.0%, a difference of 0.030%), Scottish (27.0%, a difference of 0.030%), Bulgarian (27.0%, a difference of 0.050%), and Luxembourger (27.0%, a difference of 0.080%).
| Demographics | Rating | Rank | Family Households with Children |
| Paraguayans | 9.4 /100 | #222 | Tragic 27.1% |
| Pima | 9.2 /100 | #223 | Tragic 27.1% |
| Germans | 8.7 /100 | #224 | Tragic 27.1% |
| Canadians | 7.5 /100 | #225 | Tragic 27.1% |
| Czechoslovakians | 6.6 /100 | #226 | Tragic 27.0% |
| Tsimshian | 6.6 /100 | #227 | Tragic 27.0% |
| Scottish | 6.5 /100 | #228 | Tragic 27.0% |
| Immigrants | Caribbean | 6.3 /100 | #229 | Tragic 27.0% |
| Bulgarians | 5.8 /100 | #230 | Tragic 27.0% |
| Luxembourgers | 5.5 /100 | #231 | Tragic 27.0% |
| Yugoslavians | 5.1 /100 | #232 | Tragic 27.0% |
| Immigrants | Italy | 5.0 /100 | #233 | Tragic 27.0% |
| Immigrants | Germany | 4.4 /100 | #234 | Tragic 27.0% |
| Immigrants | Morocco | 4.2 /100 | #235 | Tragic 27.0% |
| Cape Verdeans | 3.6 /100 | #236 | Tragic 26.9% |