Yuman vs Bermudan 2nd Grade
COMPARE
Yuman
Bermudan
2nd Grade
2nd Grade Comparison
Yuman
Bermudans
97.8%
2ND GRADE
20.0/ 100
METRIC RATING
203rd/ 347
METRIC RANK
97.9%
2ND GRADE
59.4/ 100
METRIC RATING
163rd/ 347
METRIC RANK
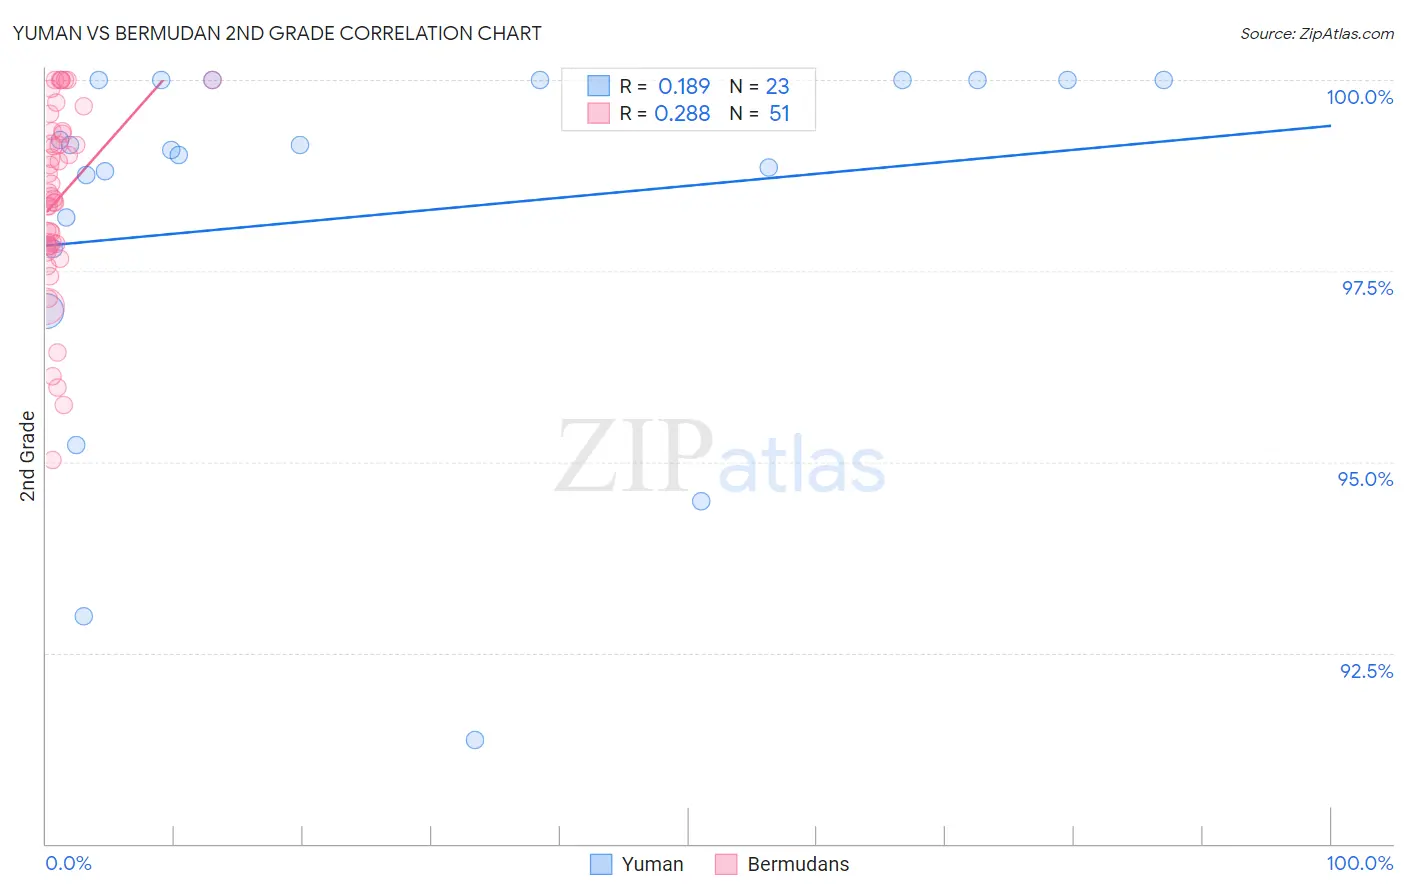
Yuman vs Bermudan 2nd Grade Correlation Chart
The statistical analysis conducted on geographies consisting of 40,696,349 people shows a poor positive correlation between the proportion of Yuman and percentage of population with at least 2nd grade education in the United States with a correlation coefficient (R) of 0.189 and weighted average of 97.8%. Similarly, the statistical analysis conducted on geographies consisting of 55,721,975 people shows a weak positive correlation between the proportion of Bermudans and percentage of population with at least 2nd grade education in the United States with a correlation coefficient (R) of 0.288 and weighted average of 97.9%, a difference of 0.14%.
2nd Grade Correlation Summary
| Measurement | Yuman | Bermudan |
| Minimum | 91.4% | 95.0% |
| Maximum | 100.0% | 100.0% |
| Range | 8.6% | 5.0% |
| Mean | 98.2% | 98.4% |
| Median | 99.1% | 98.5% |
| Interquartile 25% (IQ1) | 97.8% | 97.8% |
| Interquartile 75% (IQ3) | 100.0% | 99.3% |
| Interquartile Range (IQR) | 2.2% | 1.5% |
| Standard Deviation (Sample) | 2.4% | 1.2% |
| Standard Deviation (Population) | 2.4% | 1.2% |
Similar Demographics by 2nd Grade
Demographics Similar to Yuman by 2nd Grade
In terms of 2nd grade, the demographic groups most similar to Yuman are Immigrants from Lebanon (97.8%, a difference of 0.0%), Tohono O'odham (97.8%, a difference of 0.0%), Immigrants from Ukraine (97.8%, a difference of 0.0%), Immigrants from Albania (97.8%, a difference of 0.010%), and Immigrants from Southern Europe (97.8%, a difference of 0.010%).
| Demographics | Rating | Rank | 2nd Grade |
| Immigrants | Kenya | 26.4 /100 | #196 | Fair 97.8% |
| Immigrants | Uganda | 26.3 /100 | #197 | Fair 97.8% |
| Guamanians/Chamorros | 25.7 /100 | #198 | Fair 97.8% |
| Immigrants | Egypt | 24.4 /100 | #199 | Fair 97.8% |
| Immigrants | Lebanon | 20.9 /100 | #200 | Fair 97.8% |
| Tohono O'odham | 20.9 /100 | #201 | Fair 97.8% |
| Immigrants | Ukraine | 20.5 /100 | #202 | Fair 97.8% |
| Yuman | 20.0 /100 | #203 | Fair 97.8% |
| Immigrants | Albania | 18.4 /100 | #204 | Poor 97.8% |
| Immigrants | Southern Europe | 18.1 /100 | #205 | Poor 97.8% |
| Immigrants | Chile | 17.3 /100 | #206 | Poor 97.7% |
| Africans | 15.6 /100 | #207 | Poor 97.7% |
| Immigrants | Northern Africa | 12.3 /100 | #208 | Poor 97.7% |
| Immigrants | Oceania | 10.9 /100 | #209 | Poor 97.7% |
| Costa Ricans | 10.5 /100 | #210 | Poor 97.7% |
Demographics Similar to Bermudans by 2nd Grade
In terms of 2nd grade, the demographic groups most similar to Bermudans are Immigrants from Russia (97.9%, a difference of 0.0%), Immigrants from Italy (97.9%, a difference of 0.0%), Dutch West Indian (97.9%, a difference of 0.010%), Venezuelan (97.9%, a difference of 0.010%), and Immigrants from Iran (97.9%, a difference of 0.010%).
| Demographics | Rating | Rank | 2nd Grade |
| Dutch West Indians | 63.8 /100 | #156 | Good 97.9% |
| Venezuelans | 63.3 /100 | #157 | Good 97.9% |
| Immigrants | Iran | 62.8 /100 | #158 | Good 97.9% |
| Comanche | 62.8 /100 | #159 | Good 97.9% |
| Immigrants | Eastern Europe | 61.1 /100 | #160 | Good 97.9% |
| Immigrants | Russia | 60.3 /100 | #161 | Good 97.9% |
| Immigrants | Italy | 60.2 /100 | #162 | Good 97.9% |
| Bermudans | 59.4 /100 | #163 | Average 97.9% |
| Ugandans | 56.6 /100 | #164 | Average 97.9% |
| Spanish Americans | 56.4 /100 | #165 | Average 97.9% |
| Immigrants | Jordan | 56.3 /100 | #166 | Average 97.9% |
| Chileans | 56.1 /100 | #167 | Average 97.9% |
| Brazilians | 55.8 /100 | #168 | Average 97.9% |
| Immigrants | Spain | 55.4 /100 | #169 | Average 97.9% |
| Navajo | 54.3 /100 | #170 | Average 97.9% |