German Russian vs Bermudan Family Households with Children
COMPARE
German Russian
Bermudan
Family Households with Children
Family Households with Children Comparison
German Russians
Bermudans
26.8%
FAMILY HOUSEHOLDS WITH CHILDREN
1.5/ 100
METRIC RATING
255th/ 347
METRIC RANK
26.3%
FAMILY HOUSEHOLDS WITH CHILDREN
0.1/ 100
METRIC RATING
306th/ 347
METRIC RANK
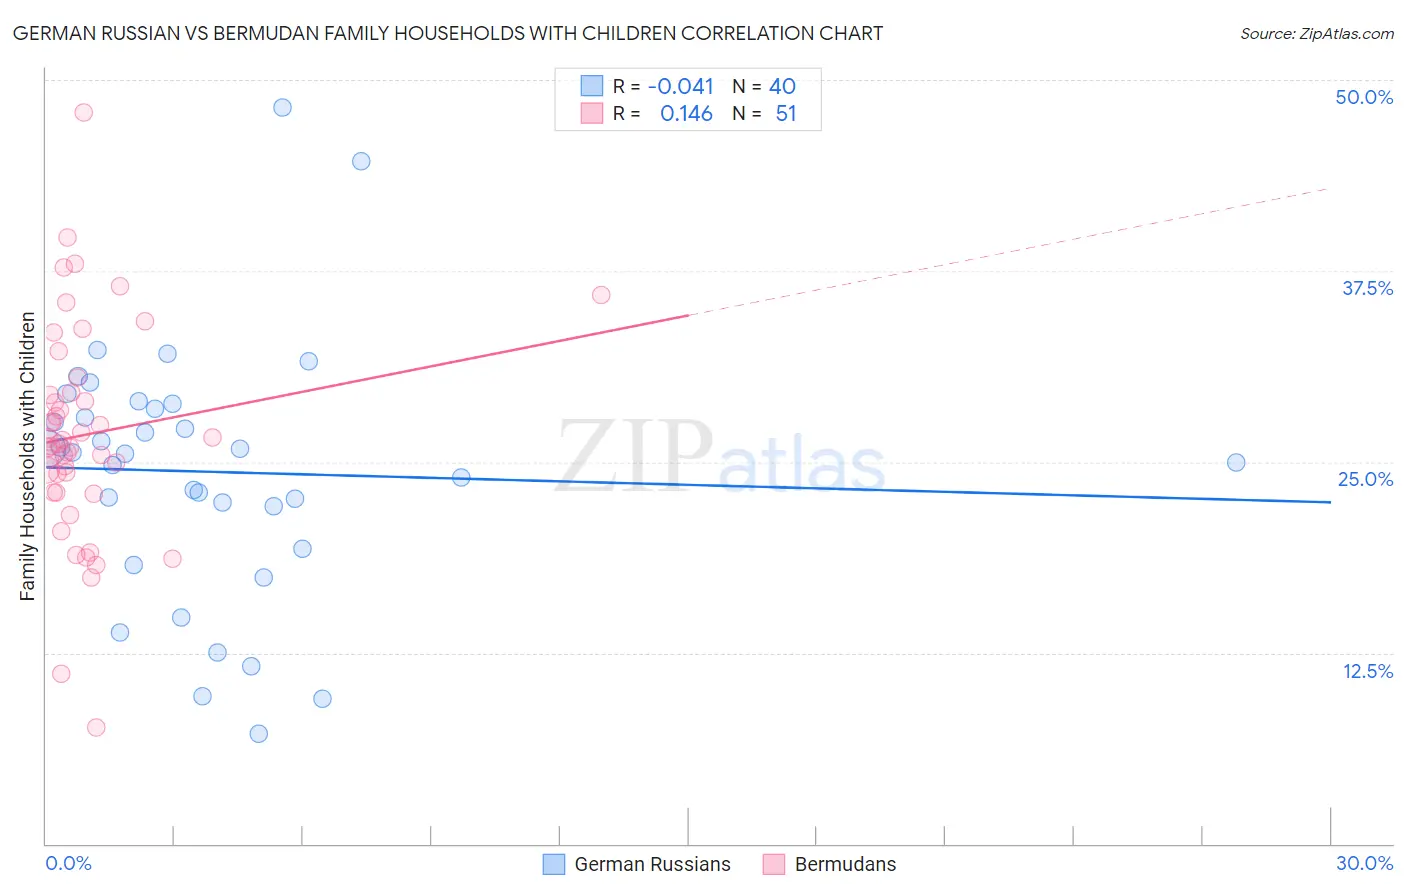
German Russian vs Bermudan Family Households with Children Correlation Chart
The statistical analysis conducted on geographies consisting of 96,442,482 people shows no correlation between the proportion of German Russians and percentage of family households with children in the United States with a correlation coefficient (R) of -0.041 and weighted average of 26.8%. Similarly, the statistical analysis conducted on geographies consisting of 55,716,155 people shows a poor positive correlation between the proportion of Bermudans and percentage of family households with children in the United States with a correlation coefficient (R) of 0.146 and weighted average of 26.3%, a difference of 1.9%.
Family Households with Children Correlation Summary
| Measurement | German Russian | Bermudan |
| Minimum | 7.2% | 7.6% |
| Maximum | 48.2% | 47.9% |
| Range | 41.0% | 40.3% |
| Mean | 24.4% | 26.8% |
| Median | 25.6% | 26.2% |
| Interquartile 25% (IQ1) | 20.7% | 23.0% |
| Interquartile 75% (IQ3) | 28.7% | 29.6% |
| Interquartile Range (IQR) | 7.9% | 6.5% |
| Standard Deviation (Sample) | 8.4% | 7.1% |
| Standard Deviation (Population) | 8.3% | 7.0% |
Similar Demographics by Family Households with Children
Demographics Similar to German Russians by Family Households with Children
In terms of family households with children, the demographic groups most similar to German Russians are Immigrants from Scotland (26.8%, a difference of 0.0%), Scotch-Irish (26.8%, a difference of 0.010%), Italian (26.8%, a difference of 0.030%), Slavic (26.8%, a difference of 0.060%), and Immigrants from Cuba (26.8%, a difference of 0.070%).
| Demographics | Rating | Rank | Family Households with Children |
| Immigrants | Kazakhstan | 2.2 /100 | #248 | Tragic 26.9% |
| Immigrants | Eastern Europe | 2.1 /100 | #249 | Tragic 26.9% |
| Belgians | 2.1 /100 | #250 | Tragic 26.9% |
| Immigrants | Bosnia and Herzegovina | 1.9 /100 | #251 | Tragic 26.8% |
| Irish | 1.8 /100 | #252 | Tragic 26.8% |
| Italians | 1.5 /100 | #253 | Tragic 26.8% |
| Immigrants | Scotland | 1.5 /100 | #254 | Tragic 26.8% |
| German Russians | 1.5 /100 | #255 | Tragic 26.8% |
| Scotch-Irish | 1.4 /100 | #256 | Tragic 26.8% |
| Slavs | 1.3 /100 | #257 | Tragic 26.8% |
| Immigrants | Cuba | 1.3 /100 | #258 | Tragic 26.8% |
| Immigrants | Lithuania | 1.2 /100 | #259 | Tragic 26.8% |
| Immigrants | Jamaica | 1.2 /100 | #260 | Tragic 26.8% |
| Immigrants | Belarus | 1.1 /100 | #261 | Tragic 26.8% |
| Immigrants | Russia | 1.0 /100 | #262 | Tragic 26.8% |
Demographics Similar to Bermudans by Family Households with Children
In terms of family households with children, the demographic groups most similar to Bermudans are Guyanese (26.3%, a difference of 0.010%), Immigrants from Bahamas (26.3%, a difference of 0.040%), West Indian (26.3%, a difference of 0.080%), Immigrants from Guyana (26.3%, a difference of 0.090%), and Lumbee (26.3%, a difference of 0.10%).
| Demographics | Rating | Rank | Family Households with Children |
| Trinidadians and Tobagonians | 0.1 /100 | #299 | Tragic 26.4% |
| Paiute | 0.1 /100 | #300 | Tragic 26.4% |
| Immigrants | Trinidad and Tobago | 0.1 /100 | #301 | Tragic 26.4% |
| Serbians | 0.1 /100 | #302 | Tragic 26.4% |
| Immigrants | Guyana | 0.1 /100 | #303 | Tragic 26.3% |
| Immigrants | Bahamas | 0.1 /100 | #304 | Tragic 26.3% |
| Guyanese | 0.1 /100 | #305 | Tragic 26.3% |
| Bermudans | 0.1 /100 | #306 | Tragic 26.3% |
| West Indians | 0.0 /100 | #307 | Tragic 26.3% |
| Lumbee | 0.0 /100 | #308 | Tragic 26.3% |
| Immigrants | Somalia | 0.0 /100 | #309 | Tragic 26.3% |
| Marshallese | 0.0 /100 | #310 | Tragic 26.2% |
| Colville | 0.0 /100 | #311 | Tragic 26.2% |
| Immigrants | Czechoslovakia | 0.0 /100 | #312 | Tragic 26.2% |
| Cree | 0.0 /100 | #313 | Tragic 26.2% |