Yugoslavian vs Bermudan Currently Married
COMPARE
Yugoslavian
Bermudan
Currently Married
Currently Married Comparison
Yugoslavians
Bermudans
47.2%
CURRENTLY MARRIED
77.4/ 100
METRIC RATING
139th/ 347
METRIC RANK
43.5%
CURRENTLY MARRIED
0.1/ 100
METRIC RATING
271st/ 347
METRIC RANK
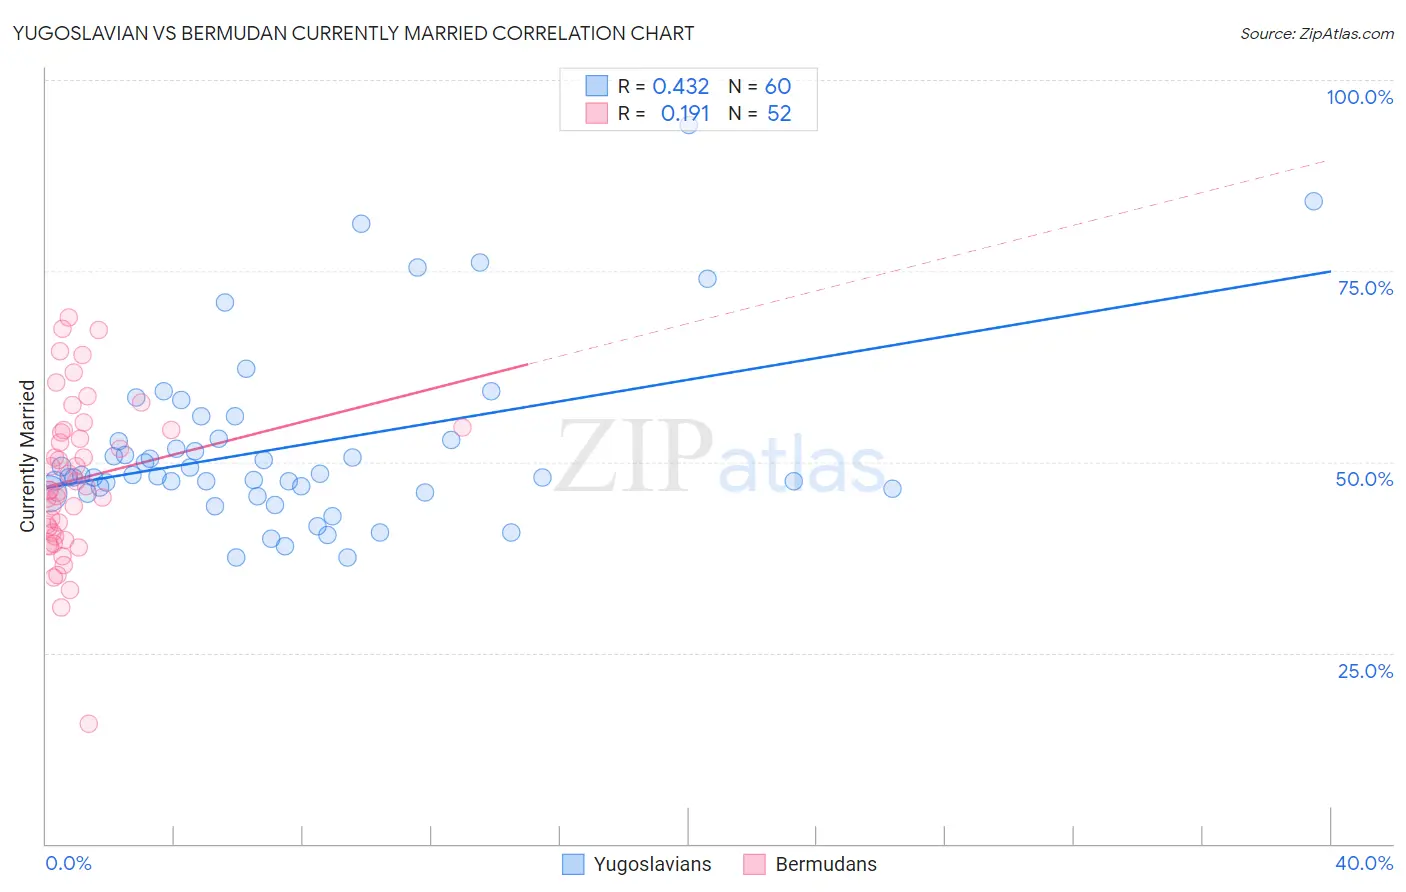
Yugoslavian vs Bermudan Currently Married Correlation Chart
The statistical analysis conducted on geographies consisting of 285,712,182 people shows a moderate positive correlation between the proportion of Yugoslavians and percentage of population currently married in the United States with a correlation coefficient (R) of 0.432 and weighted average of 47.2%. Similarly, the statistical analysis conducted on geographies consisting of 55,732,325 people shows a poor positive correlation between the proportion of Bermudans and percentage of population currently married in the United States with a correlation coefficient (R) of 0.191 and weighted average of 43.5%, a difference of 8.5%.
Currently Married Correlation Summary
| Measurement | Yugoslavian | Bermudan |
| Minimum | 37.5% | 15.7% |
| Maximum | 94.1% | 68.9% |
| Range | 56.6% | 53.2% |
| Mean | 52.0% | 47.7% |
| Median | 48.2% | 46.6% |
| Interquartile 25% (IQ1) | 46.2% | 40.5% |
| Interquartile 75% (IQ3) | 52.9% | 54.2% |
| Interquartile Range (IQR) | 6.7% | 13.7% |
| Standard Deviation (Sample) | 11.6% | 10.4% |
| Standard Deviation (Population) | 11.5% | 10.3% |
Similar Demographics by Currently Married
Demographics Similar to Yugoslavians by Currently Married
In terms of currently married, the demographic groups most similar to Yugoslavians are Pakistani (47.2%, a difference of 0.0%), Paraguayan (47.2%, a difference of 0.020%), Immigrants from Vietnam (47.2%, a difference of 0.040%), Cajun (47.1%, a difference of 0.11%), and Immigrants from Norway (47.2%, a difference of 0.12%).
| Demographics | Rating | Rank | Currently Married |
| Afghans | 81.8 /100 | #132 | Excellent 47.3% |
| Immigrants | Malaysia | 81.1 /100 | #133 | Excellent 47.3% |
| Immigrants | Australia | 81.1 /100 | #134 | Excellent 47.3% |
| Immigrants | Norway | 79.7 /100 | #135 | Good 47.2% |
| Immigrants | Vietnam | 78.2 /100 | #136 | Good 47.2% |
| Paraguayans | 77.8 /100 | #137 | Good 47.2% |
| Pakistanis | 77.5 /100 | #138 | Good 47.2% |
| Yugoslavians | 77.4 /100 | #139 | Good 47.2% |
| Cajuns | 75.3 /100 | #140 | Good 47.1% |
| Venezuelans | 74.4 /100 | #141 | Good 47.1% |
| Argentineans | 74.4 /100 | #142 | Good 47.1% |
| Guamanians/Chamorros | 74.2 /100 | #143 | Good 47.1% |
| Hmong | 73.4 /100 | #144 | Good 47.1% |
| Immigrants | South Eastern Asia | 72.9 /100 | #145 | Good 47.1% |
| Carpatho Rusyns | 72.6 /100 | #146 | Good 47.0% |
Demographics Similar to Bermudans by Currently Married
In terms of currently married, the demographic groups most similar to Bermudans are Salvadoran (43.5%, a difference of 0.020%), Indonesian (43.5%, a difference of 0.040%), Yaqui (43.4%, a difference of 0.080%), Immigrants from Sudan (43.5%, a difference of 0.090%), and Nigerian (43.4%, a difference of 0.10%).
| Demographics | Rating | Rank | Currently Married |
| Sudanese | 0.1 /100 | #264 | Tragic 43.7% |
| Immigrants | Bangladesh | 0.1 /100 | #265 | Tragic 43.6% |
| Ecuadorians | 0.1 /100 | #266 | Tragic 43.6% |
| Immigrants | Eritrea | 0.1 /100 | #267 | Tragic 43.6% |
| Spanish American Indians | 0.1 /100 | #268 | Tragic 43.6% |
| Immigrants | Sudan | 0.1 /100 | #269 | Tragic 43.5% |
| Salvadorans | 0.1 /100 | #270 | Tragic 43.5% |
| Bermudans | 0.1 /100 | #271 | Tragic 43.5% |
| Indonesians | 0.1 /100 | #272 | Tragic 43.5% |
| Yaqui | 0.1 /100 | #273 | Tragic 43.4% |
| Nigerians | 0.1 /100 | #274 | Tragic 43.4% |
| Colville | 0.1 /100 | #275 | Tragic 43.4% |
| Sierra Leoneans | 0.1 /100 | #276 | Tragic 43.4% |
| Immigrants | Nigeria | 0.1 /100 | #277 | Tragic 43.4% |
| Central Americans | 0.0 /100 | #278 | Tragic 43.3% |