Immigrants from Micronesia vs Bermudan Currently Married
COMPARE
Immigrants from Micronesia
Bermudan
Currently Married
Currently Married Comparison
Immigrants from Micronesia
Bermudans
45.6%
CURRENTLY MARRIED
8.8/ 100
METRIC RATING
209th/ 347
METRIC RANK
43.5%
CURRENTLY MARRIED
0.1/ 100
METRIC RATING
271st/ 347
METRIC RANK
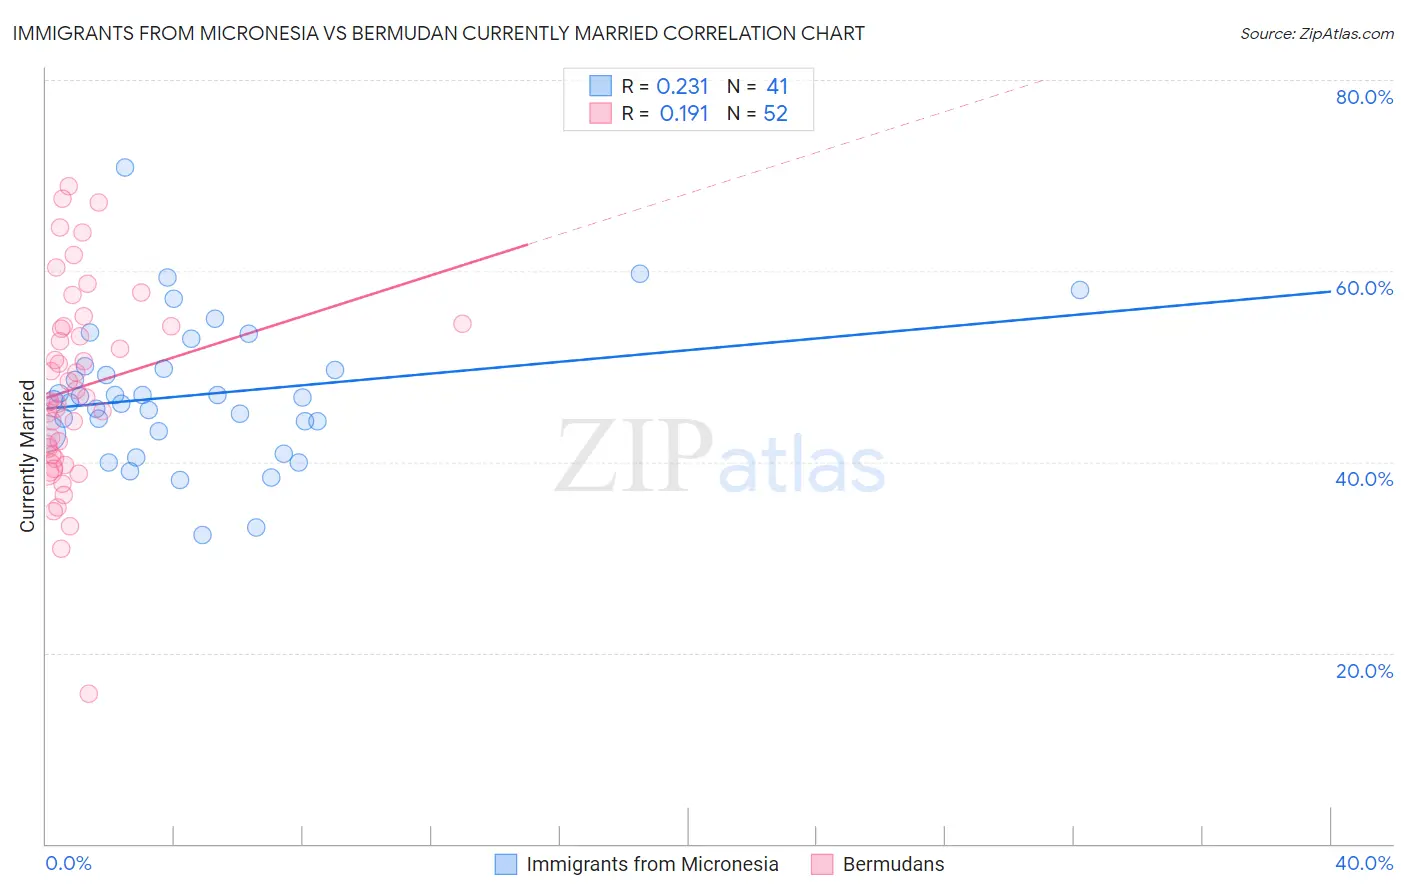
Immigrants from Micronesia vs Bermudan Currently Married Correlation Chart
The statistical analysis conducted on geographies consisting of 61,606,735 people shows a weak positive correlation between the proportion of Immigrants from Micronesia and percentage of population currently married in the United States with a correlation coefficient (R) of 0.231 and weighted average of 45.6%. Similarly, the statistical analysis conducted on geographies consisting of 55,732,325 people shows a poor positive correlation between the proportion of Bermudans and percentage of population currently married in the United States with a correlation coefficient (R) of 0.191 and weighted average of 43.5%, a difference of 4.9%.
Currently Married Correlation Summary
| Measurement | Immigrants from Micronesia | Bermudan |
| Minimum | 32.3% | 15.7% |
| Maximum | 70.8% | 68.9% |
| Range | 38.5% | 53.2% |
| Mean | 47.1% | 47.7% |
| Median | 46.5% | 46.6% |
| Interquartile 25% (IQ1) | 43.1% | 40.5% |
| Interquartile 75% (IQ3) | 49.9% | 54.2% |
| Interquartile Range (IQR) | 6.8% | 13.7% |
| Standard Deviation (Sample) | 7.4% | 10.4% |
| Standard Deviation (Population) | 7.3% | 10.3% |
Similar Demographics by Currently Married
Demographics Similar to Immigrants from Micronesia by Currently Married
In terms of currently married, the demographic groups most similar to Immigrants from Micronesia are Uruguayan (45.6%, a difference of 0.11%), Houma (45.5%, a difference of 0.20%), Marshallese (45.5%, a difference of 0.20%), Alsatian (45.7%, a difference of 0.21%), and Immigrants from South America (45.7%, a difference of 0.22%).
| Demographics | Rating | Rank | Currently Married |
| Immigrants | Albania | 14.5 /100 | #202 | Poor 45.9% |
| Taiwanese | 11.7 /100 | #203 | Poor 45.8% |
| Immigrants | Spain | 11.6 /100 | #204 | Poor 45.8% |
| South American Indians | 11.5 /100 | #205 | Poor 45.8% |
| Immigrants | Immigrants | 11.2 /100 | #206 | Poor 45.8% |
| Immigrants | South America | 10.8 /100 | #207 | Poor 45.7% |
| Alsatians | 10.8 /100 | #208 | Poor 45.7% |
| Immigrants | Micronesia | 8.8 /100 | #209 | Tragic 45.6% |
| Uruguayans | 7.9 /100 | #210 | Tragic 45.6% |
| Houma | 7.2 /100 | #211 | Tragic 45.5% |
| Marshallese | 7.2 /100 | #212 | Tragic 45.5% |
| Alaska Natives | 7.0 /100 | #213 | Tragic 45.5% |
| Dutch West Indians | 6.7 /100 | #214 | Tragic 45.5% |
| German Russians | 6.7 /100 | #215 | Tragic 45.5% |
| Immigrants | Morocco | 5.5 /100 | #216 | Tragic 45.4% |
Demographics Similar to Bermudans by Currently Married
In terms of currently married, the demographic groups most similar to Bermudans are Salvadoran (43.5%, a difference of 0.020%), Indonesian (43.5%, a difference of 0.040%), Yaqui (43.4%, a difference of 0.080%), Immigrants from Sudan (43.5%, a difference of 0.090%), and Nigerian (43.4%, a difference of 0.10%).
| Demographics | Rating | Rank | Currently Married |
| Sudanese | 0.1 /100 | #264 | Tragic 43.7% |
| Immigrants | Bangladesh | 0.1 /100 | #265 | Tragic 43.6% |
| Ecuadorians | 0.1 /100 | #266 | Tragic 43.6% |
| Immigrants | Eritrea | 0.1 /100 | #267 | Tragic 43.6% |
| Spanish American Indians | 0.1 /100 | #268 | Tragic 43.6% |
| Immigrants | Sudan | 0.1 /100 | #269 | Tragic 43.5% |
| Salvadorans | 0.1 /100 | #270 | Tragic 43.5% |
| Bermudans | 0.1 /100 | #271 | Tragic 43.5% |
| Indonesians | 0.1 /100 | #272 | Tragic 43.5% |
| Yaqui | 0.1 /100 | #273 | Tragic 43.4% |
| Nigerians | 0.1 /100 | #274 | Tragic 43.4% |
| Colville | 0.1 /100 | #275 | Tragic 43.4% |
| Sierra Leoneans | 0.1 /100 | #276 | Tragic 43.4% |
| Immigrants | Nigeria | 0.1 /100 | #277 | Tragic 43.4% |
| Central Americans | 0.0 /100 | #278 | Tragic 43.3% |