Yakama vs Israeli Single Mother Households
COMPARE
Yakama
Israeli
Single Mother Households
Single Mother Households Comparison
Yakama
Israelis
8.4%
SINGLE MOTHER HOUSEHOLDS
0.0/ 100
METRIC RATING
328th/ 347
METRIC RANK
5.7%
SINGLE MOTHER HOUSEHOLDS
97.4/ 100
METRIC RATING
88th/ 347
METRIC RANK
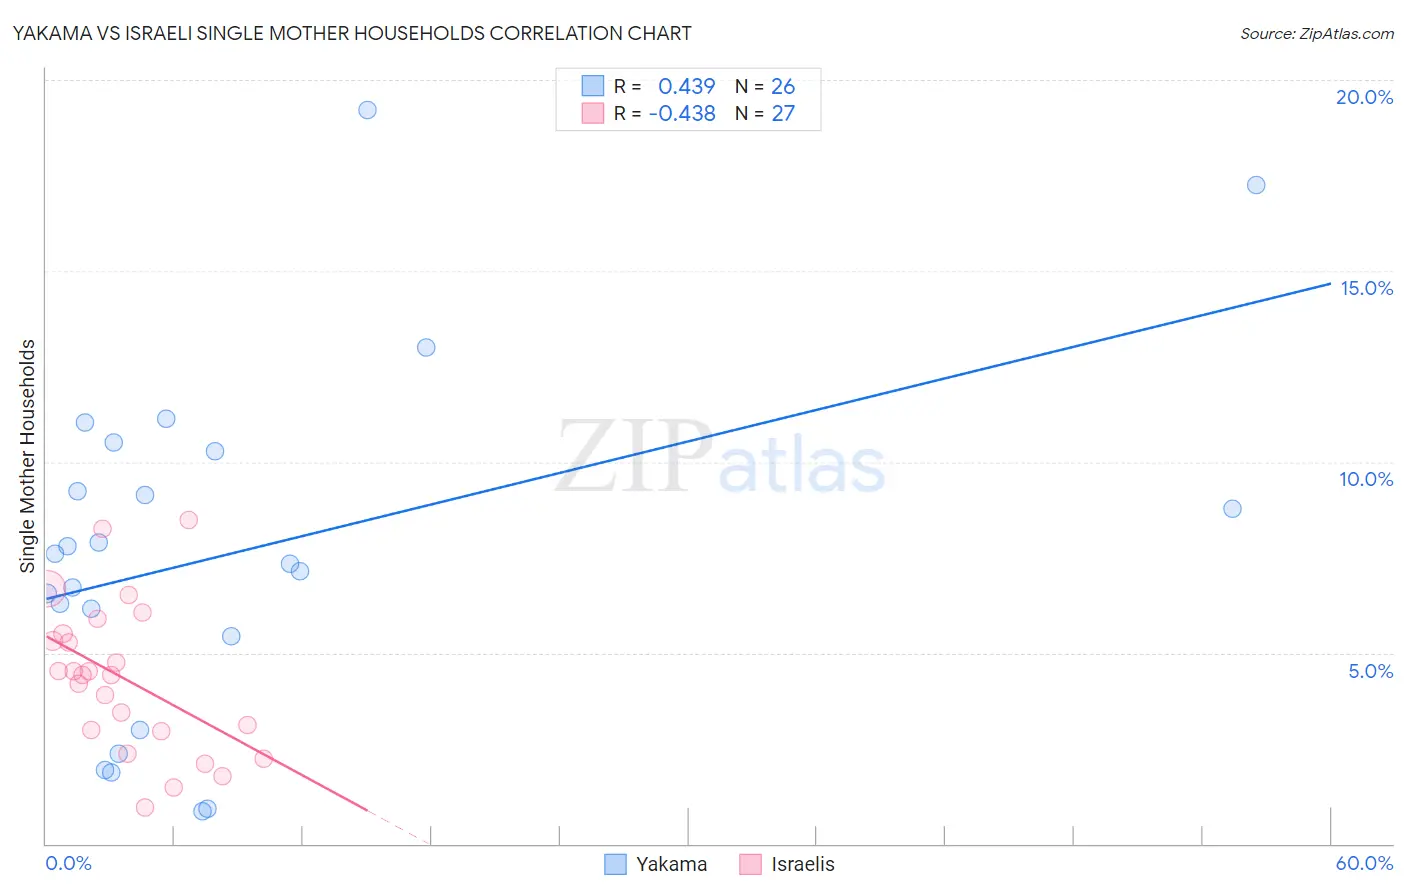
Yakama vs Israeli Single Mother Households Correlation Chart
The statistical analysis conducted on geographies consisting of 19,909,884 people shows a moderate positive correlation between the proportion of Yakama and percentage of single mother households in the United States with a correlation coefficient (R) of 0.439 and weighted average of 8.4%. Similarly, the statistical analysis conducted on geographies consisting of 210,568,675 people shows a moderate negative correlation between the proportion of Israelis and percentage of single mother households in the United States with a correlation coefficient (R) of -0.438 and weighted average of 5.7%, a difference of 48.0%.
Single Mother Households Correlation Summary
| Measurement | Yakama | Israeli |
| Minimum | 0.86% | 0.95% |
| Maximum | 19.2% | 8.5% |
| Range | 18.4% | 7.5% |
| Mean | 7.7% | 4.3% |
| Median | 7.5% | 4.4% |
| Interquartile 25% (IQ1) | 5.4% | 3.0% |
| Interquartile 75% (IQ3) | 10.3% | 5.5% |
| Interquartile Range (IQR) | 4.8% | 2.6% |
| Standard Deviation (Sample) | 4.6% | 1.9% |
| Standard Deviation (Population) | 4.5% | 1.9% |
Similar Demographics by Single Mother Households
Demographics Similar to Yakama by Single Mother Households
In terms of single mother households, the demographic groups most similar to Yakama are Immigrants from Haiti (8.4%, a difference of 0.18%), British West Indian (8.4%, a difference of 0.32%), Immigrants from Caribbean (8.4%, a difference of 0.45%), Immigrants from Jamaica (8.4%, a difference of 0.63%), and Hopi (8.5%, a difference of 0.75%).
| Demographics | Rating | Rank | Single Mother Households |
| Immigrants | Senegal | 0.0 /100 | #321 | Tragic 8.3% |
| Pima | 0.0 /100 | #322 | Tragic 8.3% |
| Haitians | 0.0 /100 | #323 | Tragic 8.3% |
| Immigrants | Jamaica | 0.0 /100 | #324 | Tragic 8.4% |
| Immigrants | Caribbean | 0.0 /100 | #325 | Tragic 8.4% |
| British West Indians | 0.0 /100 | #326 | Tragic 8.4% |
| Immigrants | Haiti | 0.0 /100 | #327 | Tragic 8.4% |
| Yakama | 0.0 /100 | #328 | Tragic 8.4% |
| Hopi | 0.0 /100 | #329 | Tragic 8.5% |
| Inupiat | 0.0 /100 | #330 | Tragic 8.5% |
| Sioux | 0.0 /100 | #331 | Tragic 8.5% |
| U.S. Virgin Islanders | 0.0 /100 | #332 | Tragic 8.6% |
| Liberians | 0.0 /100 | #333 | Tragic 8.6% |
| Immigrants | Liberia | 0.0 /100 | #334 | Tragic 8.7% |
| Immigrants | Dominica | 0.0 /100 | #335 | Tragic 8.7% |
Demographics Similar to Israelis by Single Mother Households
In terms of single mother households, the demographic groups most similar to Israelis are Immigrants from Turkey (5.7%, a difference of 0.070%), Finnish (5.7%, a difference of 0.15%), Hungarian (5.7%, a difference of 0.18%), Ukrainian (5.7%, a difference of 0.26%), and Immigrants from Indonesia (5.7%, a difference of 0.32%).
| Demographics | Rating | Rank | Single Mother Households |
| Immigrants | Moldova | 97.9 /100 | #81 | Exceptional 5.6% |
| Immigrants | Malaysia | 97.8 /100 | #82 | Exceptional 5.7% |
| Immigrants | Hungary | 97.8 /100 | #83 | Exceptional 5.7% |
| Carpatho Rusyns | 97.7 /100 | #84 | Exceptional 5.7% |
| Hungarians | 97.6 /100 | #85 | Exceptional 5.7% |
| Finns | 97.6 /100 | #86 | Exceptional 5.7% |
| Immigrants | Turkey | 97.5 /100 | #87 | Exceptional 5.7% |
| Israelis | 97.4 /100 | #88 | Exceptional 5.7% |
| Ukrainians | 97.2 /100 | #89 | Exceptional 5.7% |
| Immigrants | Indonesia | 97.2 /100 | #90 | Exceptional 5.7% |
| Europeans | 97.0 /100 | #91 | Exceptional 5.7% |
| Immigrants | Western Asia | 96.7 /100 | #92 | Exceptional 5.7% |
| Serbians | 96.7 /100 | #93 | Exceptional 5.7% |
| Basques | 96.7 /100 | #94 | Exceptional 5.7% |
| Slovaks | 96.6 /100 | #95 | Exceptional 5.7% |