Immigrants from North Macedonia vs Moroccan Currently Married
COMPARE
Immigrants from North Macedonia
Moroccan
Currently Married
Currently Married Comparison
Immigrants from North Macedonia
Moroccans
48.5%
CURRENTLY MARRIED
98.7/ 100
METRIC RATING
55th/ 347
METRIC RANK
44.6%
CURRENTLY MARRIED
0.9/ 100
METRIC RATING
238th/ 347
METRIC RANK
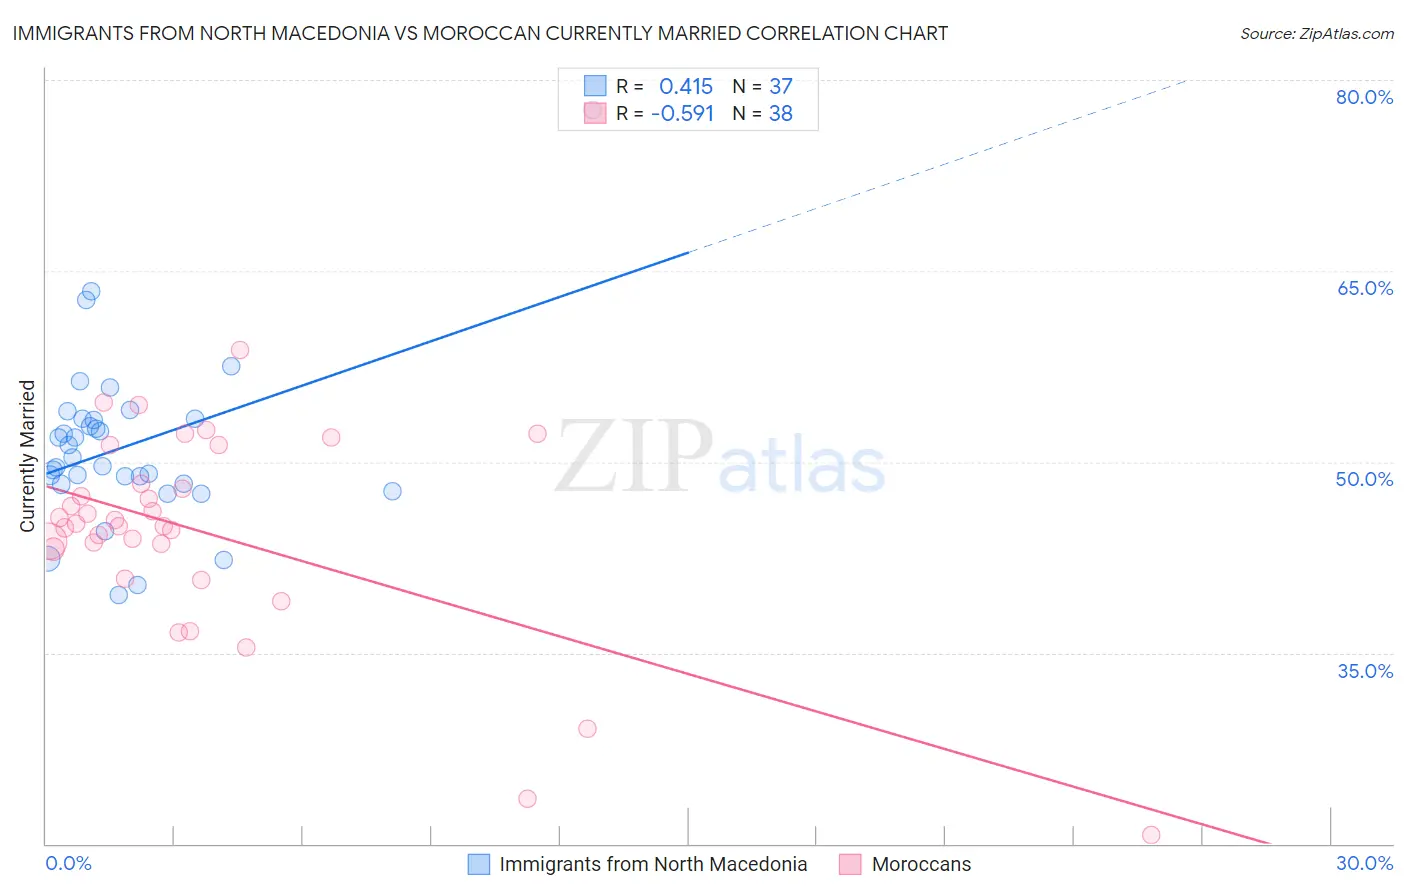
Immigrants from North Macedonia vs Moroccan Currently Married Correlation Chart
The statistical analysis conducted on geographies consisting of 74,297,543 people shows a moderate positive correlation between the proportion of Immigrants from North Macedonia and percentage of population currently married in the United States with a correlation coefficient (R) of 0.415 and weighted average of 48.5%. Similarly, the statistical analysis conducted on geographies consisting of 201,812,139 people shows a substantial negative correlation between the proportion of Moroccans and percentage of population currently married in the United States with a correlation coefficient (R) of -0.591 and weighted average of 44.6%, a difference of 8.7%.
Currently Married Correlation Summary
| Measurement | Immigrants from North Macedonia | Moroccan |
| Minimum | 39.5% | 20.7% |
| Maximum | 77.6% | 58.8% |
| Range | 38.1% | 38.1% |
| Mean | 51.3% | 44.4% |
| Median | 50.3% | 45.0% |
| Interquartile 25% (IQ1) | 48.3% | 43.1% |
| Interquartile 75% (IQ3) | 53.4% | 48.3% |
| Interquartile Range (IQR) | 5.1% | 5.2% |
| Standard Deviation (Sample) | 6.8% | 7.9% |
| Standard Deviation (Population) | 6.7% | 7.8% |
Similar Demographics by Currently Married
Demographics Similar to Immigrants from North Macedonia by Currently Married
In terms of currently married, the demographic groups most similar to Immigrants from North Macedonia are Immigrants from Moldova (48.5%, a difference of 0.0%), Latvian (48.5%, a difference of 0.0%), Immigrants from Netherlands (48.5%, a difference of 0.030%), Immigrants from Austria (48.5%, a difference of 0.070%), and French (48.4%, a difference of 0.070%).
| Demographics | Rating | Rank | Currently Married |
| Austrians | 99.2 /100 | #48 | Exceptional 48.7% |
| Bhutanese | 99.1 /100 | #49 | Exceptional 48.6% |
| Iranians | 99.0 /100 | #50 | Exceptional 48.6% |
| Whites/Caucasians | 99.0 /100 | #51 | Exceptional 48.6% |
| Russians | 98.9 /100 | #52 | Exceptional 48.6% |
| Immigrants | Austria | 98.8 /100 | #53 | Exceptional 48.5% |
| Immigrants | Moldova | 98.7 /100 | #54 | Exceptional 48.5% |
| Immigrants | North Macedonia | 98.7 /100 | #55 | Exceptional 48.5% |
| Latvians | 98.7 /100 | #56 | Exceptional 48.5% |
| Immigrants | Netherlands | 98.6 /100 | #57 | Exceptional 48.5% |
| French | 98.6 /100 | #58 | Exceptional 48.4% |
| Immigrants | Ireland | 98.5 /100 | #59 | Exceptional 48.4% |
| Immigrants | Romania | 98.5 /100 | #60 | Exceptional 48.4% |
| Romanians | 98.5 /100 | #61 | Exceptional 48.4% |
| Asians | 98.5 /100 | #62 | Exceptional 48.4% |
Demographics Similar to Moroccans by Currently Married
In terms of currently married, the demographic groups most similar to Moroccans are Cuban (44.6%, a difference of 0.080%), Seminole (44.6%, a difference of 0.080%), Alaskan Athabascan (44.6%, a difference of 0.090%), Immigrants from Mexico (44.5%, a difference of 0.14%), and Mexican American Indian (44.5%, a difference of 0.14%).
| Demographics | Rating | Rank | Currently Married |
| Immigrants | Panama | 1.5 /100 | #231 | Tragic 44.9% |
| Nepalese | 1.2 /100 | #232 | Tragic 44.7% |
| Immigrants | Saudi Arabia | 1.1 /100 | #233 | Tragic 44.7% |
| Iroquois | 1.1 /100 | #234 | Tragic 44.7% |
| Alaskan Athabascans | 0.9 /100 | #235 | Tragic 44.6% |
| Cubans | 0.9 /100 | #236 | Tragic 44.6% |
| Seminole | 0.9 /100 | #237 | Tragic 44.6% |
| Moroccans | 0.9 /100 | #238 | Tragic 44.6% |
| Immigrants | Mexico | 0.7 /100 | #239 | Tragic 44.5% |
| Mexican American Indians | 0.7 /100 | #240 | Tragic 44.5% |
| Ethiopians | 0.7 /100 | #241 | Tragic 44.5% |
| Immigrants | Cambodia | 0.7 /100 | #242 | Tragic 44.5% |
| Immigrants | Ethiopia | 0.7 /100 | #243 | Tragic 44.5% |
| Japanese | 0.6 /100 | #244 | Tragic 44.5% |
| Immigrants | Armenia | 0.4 /100 | #245 | Tragic 44.3% |