Sri Lankan vs Lithuanian Currently Married
COMPARE
Sri Lankan
Lithuanian
Currently Married
Currently Married Comparison
Sri Lankans
Lithuanians
47.3%
CURRENTLY MARRIED
83.2/ 100
METRIC RATING
129th/ 347
METRIC RANK
49.0%
CURRENTLY MARRIED
99.6/ 100
METRIC RATING
24th/ 347
METRIC RANK
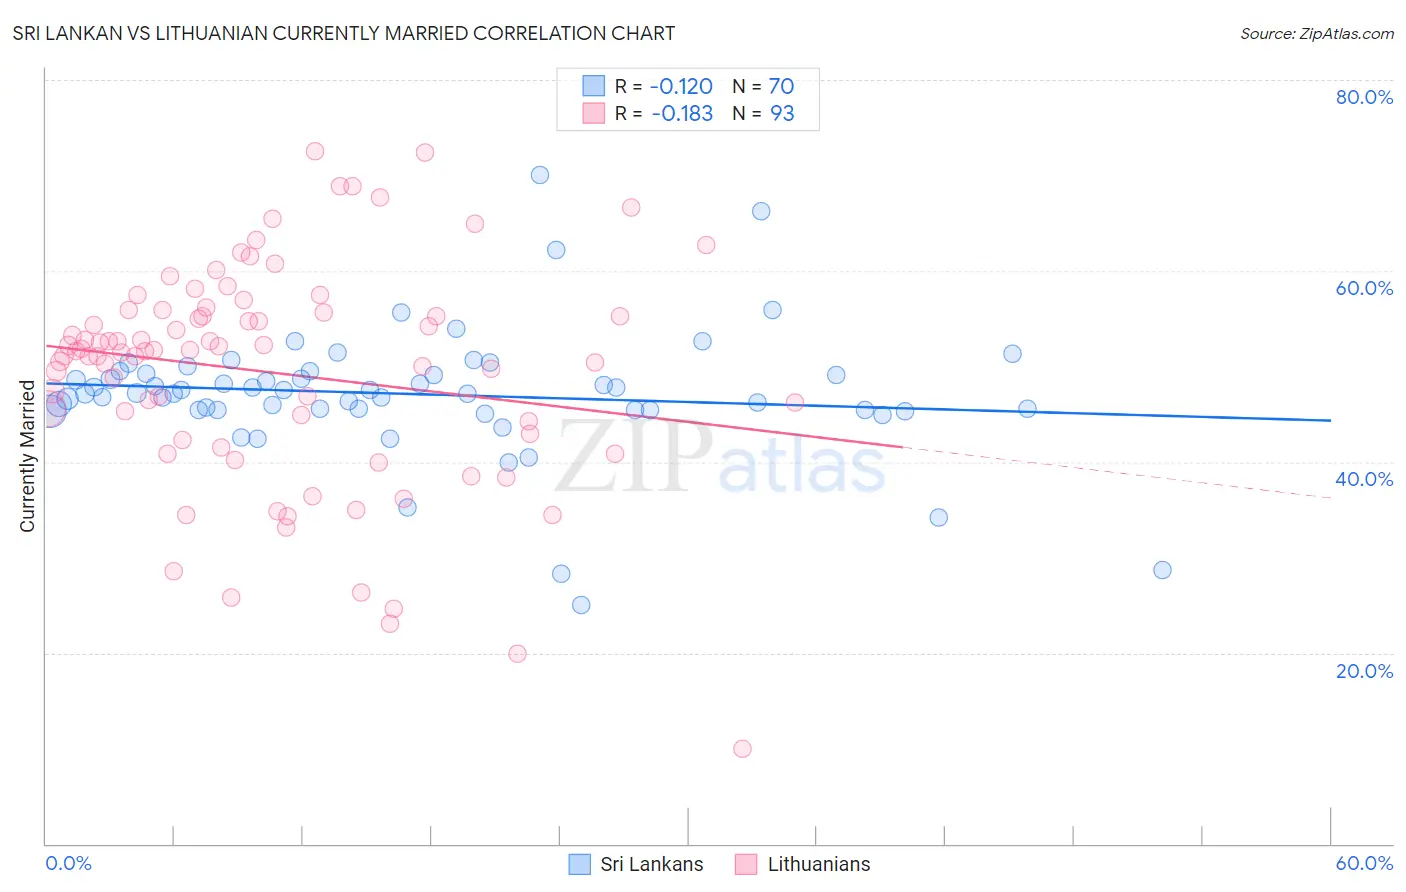
Sri Lankan vs Lithuanian Currently Married Correlation Chart
The statistical analysis conducted on geographies consisting of 440,506,479 people shows a poor negative correlation between the proportion of Sri Lankans and percentage of population currently married in the United States with a correlation coefficient (R) of -0.120 and weighted average of 47.3%. Similarly, the statistical analysis conducted on geographies consisting of 421,888,546 people shows a poor negative correlation between the proportion of Lithuanians and percentage of population currently married in the United States with a correlation coefficient (R) of -0.183 and weighted average of 49.0%, a difference of 3.6%.
Currently Married Correlation Summary
| Measurement | Sri Lankan | Lithuanian |
| Minimum | 25.0% | 10.0% |
| Maximum | 70.1% | 72.5% |
| Range | 45.1% | 62.5% |
| Mean | 47.1% | 49.3% |
| Median | 47.2% | 51.6% |
| Interquartile 25% (IQ1) | 45.4% | 42.6% |
| Interquartile 75% (IQ3) | 49.2% | 55.8% |
| Interquartile Range (IQR) | 3.8% | 13.2% |
| Standard Deviation (Sample) | 6.8% | 11.7% |
| Standard Deviation (Population) | 6.8% | 11.7% |
Similar Demographics by Currently Married
Demographics Similar to Sri Lankans by Currently Married
In terms of currently married, the demographic groups most similar to Sri Lankans are Immigrants from Iraq (47.3%, a difference of 0.030%), Icelander (47.3%, a difference of 0.050%), Portuguese (47.3%, a difference of 0.060%), Afghan (47.3%, a difference of 0.090%), and Immigrants from Jordan (47.4%, a difference of 0.11%).
| Demographics | Rating | Rank | Currently Married |
| Osage | 87.9 /100 | #122 | Excellent 47.5% |
| Immigrants | Kazakhstan | 87.2 /100 | #123 | Excellent 47.4% |
| Laotians | 86.6 /100 | #124 | Excellent 47.4% |
| Okinawans | 85.3 /100 | #125 | Excellent 47.4% |
| Immigrants | Jordan | 84.9 /100 | #126 | Excellent 47.4% |
| New Zealanders | 84.9 /100 | #127 | Excellent 47.4% |
| Portuguese | 84.2 /100 | #128 | Excellent 47.3% |
| Sri Lankans | 83.2 /100 | #129 | Excellent 47.3% |
| Immigrants | Iraq | 82.8 /100 | #130 | Excellent 47.3% |
| Icelanders | 82.4 /100 | #131 | Excellent 47.3% |
| Afghans | 81.8 /100 | #132 | Excellent 47.3% |
| Immigrants | Malaysia | 81.1 /100 | #133 | Excellent 47.3% |
| Immigrants | Australia | 81.1 /100 | #134 | Excellent 47.3% |
| Immigrants | Norway | 79.7 /100 | #135 | Good 47.2% |
| Immigrants | Vietnam | 78.2 /100 | #136 | Good 47.2% |
Demographics Similar to Lithuanians by Currently Married
In terms of currently married, the demographic groups most similar to Lithuanians are Maltese (49.0%, a difference of 0.010%), Immigrants from Korea (49.0%, a difference of 0.060%), Immigrants from Pakistan (49.1%, a difference of 0.11%), Burmese (48.9%, a difference of 0.13%), and Welsh (48.9%, a difference of 0.17%).
| Demographics | Rating | Rank | Currently Married |
| Scandinavians | 99.9 /100 | #17 | Exceptional 49.5% |
| Immigrants | Scotland | 99.8 /100 | #18 | Exceptional 49.3% |
| Europeans | 99.8 /100 | #19 | Exceptional 49.3% |
| Luxembourgers | 99.8 /100 | #20 | Exceptional 49.3% |
| Scottish | 99.8 /100 | #21 | Exceptional 49.2% |
| Bulgarians | 99.7 /100 | #22 | Exceptional 49.1% |
| Immigrants | Pakistan | 99.7 /100 | #23 | Exceptional 49.1% |
| Lithuanians | 99.6 /100 | #24 | Exceptional 49.0% |
| Maltese | 99.6 /100 | #25 | Exceptional 49.0% |
| Immigrants | Korea | 99.6 /100 | #26 | Exceptional 49.0% |
| Burmese | 99.6 /100 | #27 | Exceptional 48.9% |
| Welsh | 99.5 /100 | #28 | Exceptional 48.9% |
| Croatians | 99.5 /100 | #29 | Exceptional 48.9% |
| Eastern Europeans | 99.5 /100 | #30 | Exceptional 48.9% |
| Poles | 99.5 /100 | #31 | Exceptional 48.9% |