Welsh vs Immigrants from Korea Divorced or Separated
COMPARE
Welsh
Immigrants from Korea
Divorced or Separated
Divorced or Separated Comparison
Welsh
Immigrants from Korea
12.6%
DIVORCED OR SEPARATED
0.7/ 100
METRIC RATING
255th/ 347
METRIC RANK
10.6%
DIVORCED OR SEPARATED
100.0/ 100
METRIC RATING
16th/ 347
METRIC RANK
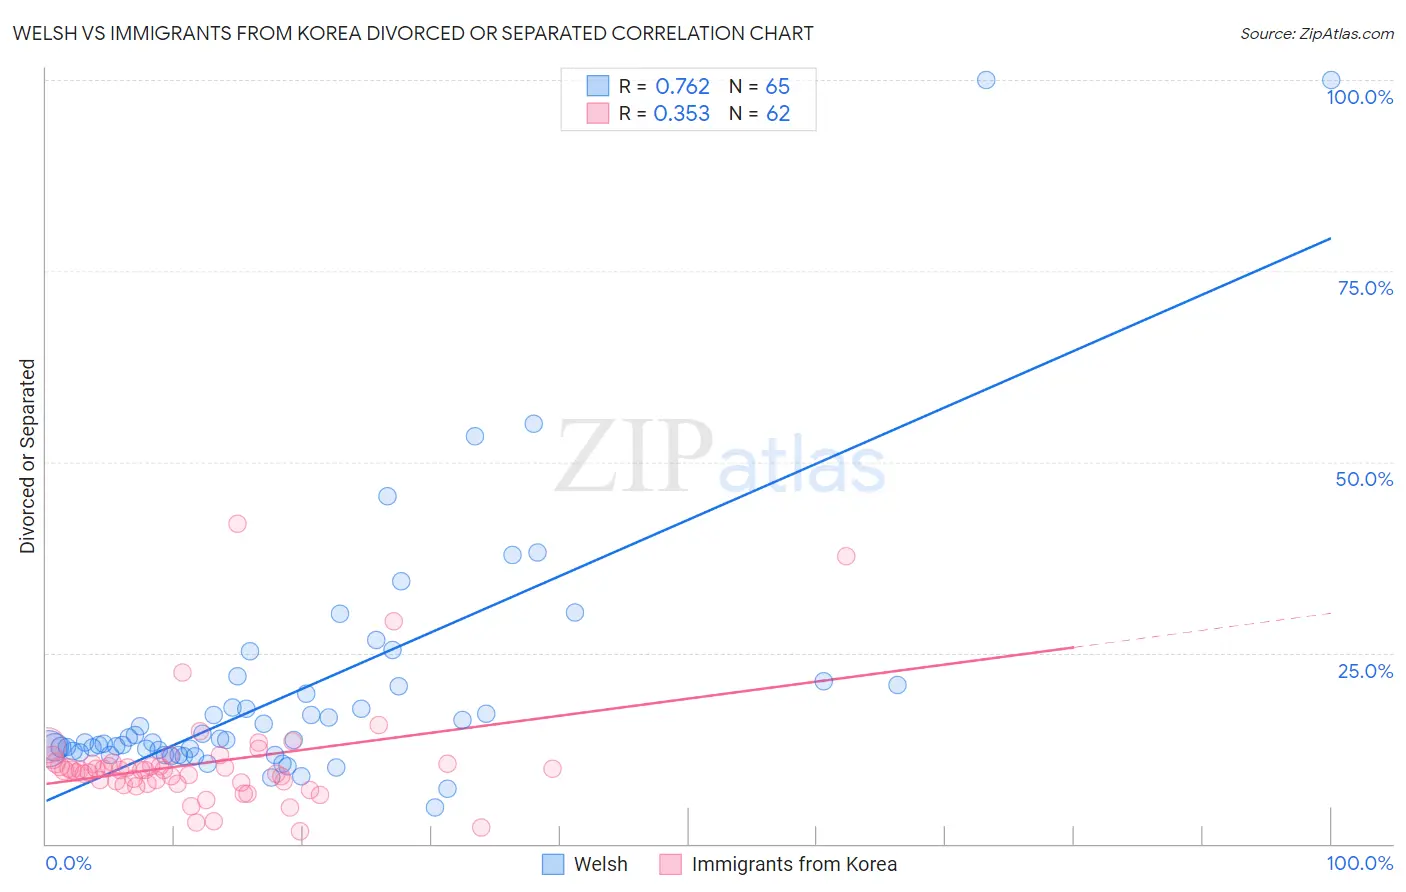
Welsh vs Immigrants from Korea Divorced or Separated Correlation Chart
The statistical analysis conducted on geographies consisting of 528,296,815 people shows a strong positive correlation between the proportion of Welsh and percentage of population currently divorced or separated in the United States with a correlation coefficient (R) of 0.762 and weighted average of 12.6%. Similarly, the statistical analysis conducted on geographies consisting of 416,074,858 people shows a mild positive correlation between the proportion of Immigrants from Korea and percentage of population currently divorced or separated in the United States with a correlation coefficient (R) of 0.353 and weighted average of 10.6%, a difference of 18.4%.
Divorced or Separated Correlation Summary
| Measurement | Welsh | Immigrants from Korea |
| Minimum | 4.7% | 1.7% |
| Maximum | 100.0% | 41.8% |
| Range | 95.3% | 40.1% |
| Mean | 20.2% | 10.5% |
| Median | 13.5% | 9.6% |
| Interquartile 25% (IQ1) | 12.1% | 8.0% |
| Interquartile 75% (IQ3) | 20.7% | 10.5% |
| Interquartile Range (IQR) | 8.6% | 2.5% |
| Standard Deviation (Sample) | 17.5% | 6.7% |
| Standard Deviation (Population) | 17.4% | 6.7% |
Similar Demographics by Divorced or Separated
Demographics Similar to Welsh by Divorced or Separated
In terms of divorced or separated, the demographic groups most similar to Welsh are Senegalese (12.6%, a difference of 0.10%), Liberian (12.6%, a difference of 0.16%), Somali (12.6%, a difference of 0.16%), Immigrants from Colombia (12.6%, a difference of 0.16%), and Immigrants from Somalia (12.6%, a difference of 0.17%).
| Demographics | Rating | Rank | Divorced or Separated |
| Nepalese | 1.8 /100 | #248 | Tragic 12.5% |
| Finns | 1.8 /100 | #249 | Tragic 12.5% |
| Irish | 1.3 /100 | #250 | Tragic 12.5% |
| Aleuts | 1.3 /100 | #251 | Tragic 12.5% |
| Liberians | 0.9 /100 | #252 | Tragic 12.6% |
| Somalis | 0.9 /100 | #253 | Tragic 12.6% |
| Senegalese | 0.8 /100 | #254 | Tragic 12.6% |
| Welsh | 0.7 /100 | #255 | Tragic 12.6% |
| Immigrants | Colombia | 0.6 /100 | #256 | Tragic 12.6% |
| Immigrants | Somalia | 0.6 /100 | #257 | Tragic 12.6% |
| Indonesians | 0.6 /100 | #258 | Tragic 12.6% |
| Yuman | 0.6 /100 | #259 | Tragic 12.6% |
| Immigrants | Uruguay | 0.6 /100 | #260 | Tragic 12.6% |
| Immigrants | Dominica | 0.5 /100 | #261 | Tragic 12.6% |
| Basques | 0.5 /100 | #262 | Tragic 12.6% |
Demographics Similar to Immigrants from Korea by Divorced or Separated
In terms of divorced or separated, the demographic groups most similar to Immigrants from Korea are Immigrants from Israel (10.6%, a difference of 0.10%), Immigrants from Iran (10.6%, a difference of 0.19%), Asian (10.6%, a difference of 0.20%), Immigrants from Armenia (10.6%, a difference of 0.44%), and Assyrian/Chaldean/Syriac (10.6%, a difference of 0.51%).
| Demographics | Rating | Rank | Divorced or Separated |
| Yup'ik | 100.0 /100 | #9 | Exceptional 10.3% |
| Immigrants | Singapore | 100.0 /100 | #10 | Exceptional 10.3% |
| Immigrants | South Central Asia | 100.0 /100 | #11 | Exceptional 10.4% |
| Okinawans | 100.0 /100 | #12 | Exceptional 10.5% |
| Cypriots | 100.0 /100 | #13 | Exceptional 10.5% |
| Assyrians/Chaldeans/Syriacs | 100.0 /100 | #14 | Exceptional 10.6% |
| Immigrants | Armenia | 100.0 /100 | #15 | Exceptional 10.6% |
| Immigrants | Korea | 100.0 /100 | #16 | Exceptional 10.6% |
| Immigrants | Israel | 100.0 /100 | #17 | Exceptional 10.6% |
| Immigrants | Iran | 100.0 /100 | #18 | Exceptional 10.6% |
| Asians | 100.0 /100 | #19 | Exceptional 10.6% |
| Burmese | 100.0 /100 | #20 | Exceptional 10.7% |
| Immigrants | Asia | 100.0 /100 | #21 | Exceptional 10.7% |
| Vietnamese | 100.0 /100 | #22 | Exceptional 10.8% |
| Immigrants | Pakistan | 100.0 /100 | #23 | Exceptional 10.8% |