Vietnamese vs Immigrants from Turkey Single Father Households
COMPARE
Vietnamese
Immigrants from Turkey
Single Father Households
Single Father Households Comparison
Vietnamese
Immigrants from Turkey
2.0%
SINGLE FATHER HOUSEHOLDS
99.9/ 100
METRIC RATING
61st/ 347
METRIC RANK
2.0%
SINGLE FATHER HOUSEHOLDS
100.0/ 100
METRIC RATING
41st/ 347
METRIC RANK
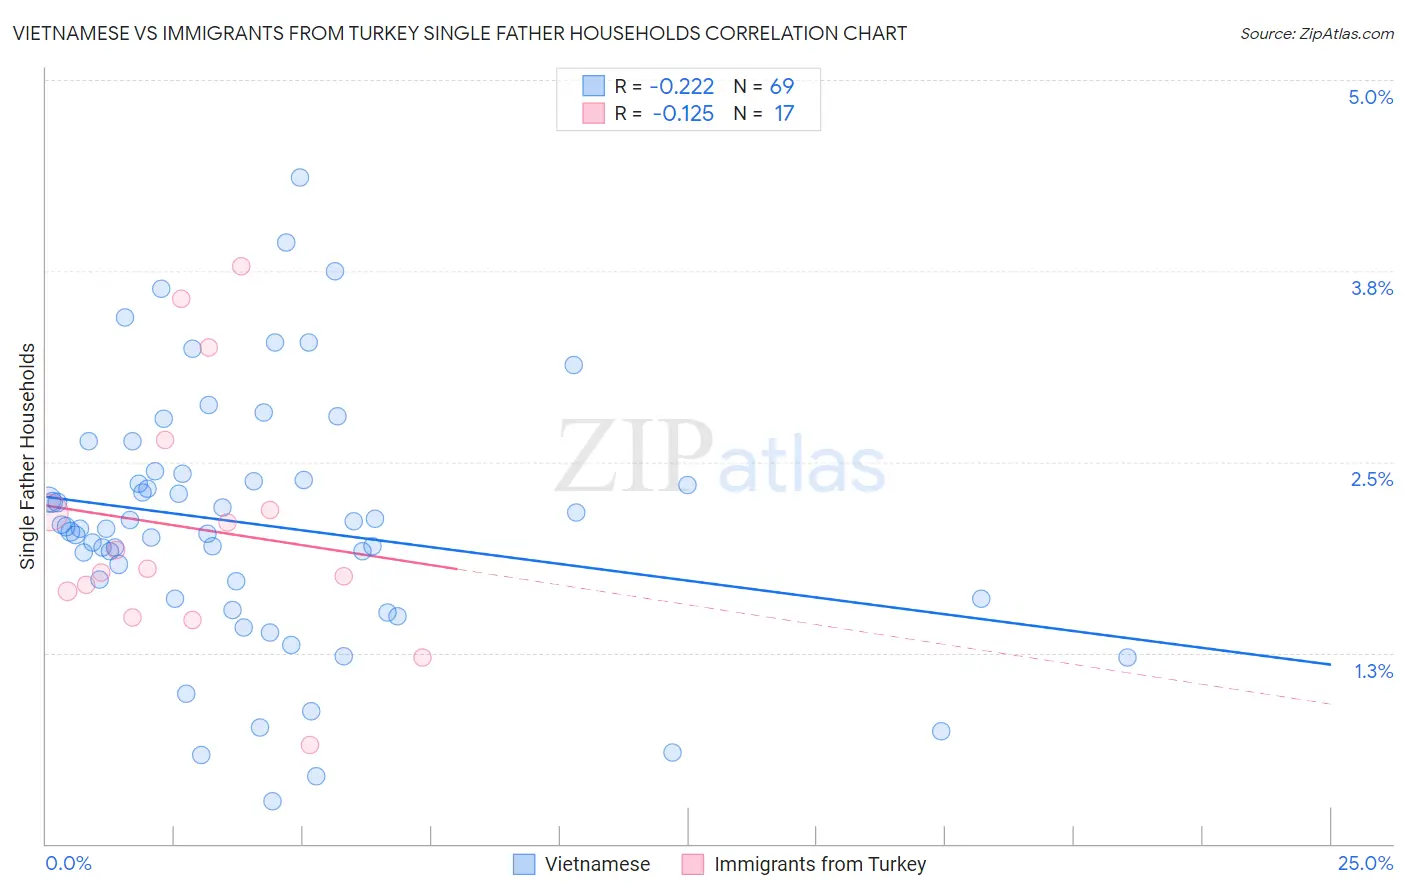
Vietnamese vs Immigrants from Turkey Single Father Households Correlation Chart
The statistical analysis conducted on geographies consisting of 170,091,169 people shows a weak negative correlation between the proportion of Vietnamese and percentage of single father households in the United States with a correlation coefficient (R) of -0.222 and weighted average of 2.0%. Similarly, the statistical analysis conducted on geographies consisting of 221,918,090 people shows a poor negative correlation between the proportion of Immigrants from Turkey and percentage of single father households in the United States with a correlation coefficient (R) of -0.125 and weighted average of 2.0%, a difference of 2.2%.
Single Father Households Correlation Summary
| Measurement | Vietnamese | Immigrants from Turkey |
| Minimum | 0.28% | 0.65% |
| Maximum | 4.4% | 3.8% |
| Range | 4.1% | 3.1% |
| Mean | 2.1% | 2.1% |
| Median | 2.1% | 1.8% |
| Interquartile 25% (IQ1) | 1.6% | 1.6% |
| Interquartile 75% (IQ3) | 2.4% | 2.4% |
| Interquartile Range (IQR) | 0.79% | 0.84% |
| Standard Deviation (Sample) | 0.82% | 0.83% |
| Standard Deviation (Population) | 0.82% | 0.80% |
Demographics Similar to Vietnamese and Immigrants from Turkey by Single Father Households
In terms of single father households, the demographic groups most similar to Vietnamese are Immigrants from Austria (2.0%, a difference of 0.24%), Immigrants from North Macedonia (2.0%, a difference of 0.25%), Immigrants from Czechoslovakia (2.0%, a difference of 0.35%), Burmese (2.0%, a difference of 0.38%), and Immigrants from Norway (2.0%, a difference of 0.64%). Similarly, the demographic groups most similar to Immigrants from Turkey are Macedonian (2.0%, a difference of 0.15%), Immigrants from Grenada (2.0%, a difference of 0.38%), Latvian (2.0%, a difference of 0.46%), Russian (2.0%, a difference of 0.48%), and Immigrants from Lebanon (2.0%, a difference of 0.59%).
| Demographics | Rating | Rank | Single Father Households |
| Immigrants | Turkey | 100.0 /100 | #41 | Exceptional 2.0% |
| Macedonians | 100.0 /100 | #42 | Exceptional 2.0% |
| Immigrants | Grenada | 100.0 /100 | #43 | Exceptional 2.0% |
| Latvians | 100.0 /100 | #44 | Exceptional 2.0% |
| Russians | 100.0 /100 | #45 | Exceptional 2.0% |
| Immigrants | Lebanon | 100.0 /100 | #46 | Exceptional 2.0% |
| Immigrants | Ukraine | 99.9 /100 | #47 | Exceptional 2.0% |
| Immigrants | Kazakhstan | 99.9 /100 | #48 | Exceptional 2.0% |
| Immigrants | Serbia | 99.9 /100 | #49 | Exceptional 2.0% |
| Immigrants | Switzerland | 99.9 /100 | #50 | Exceptional 2.0% |
| Immigrants | Poland | 99.9 /100 | #51 | Exceptional 2.0% |
| Immigrants | Europe | 99.9 /100 | #52 | Exceptional 2.0% |
| Immigrants | Northern Europe | 99.9 /100 | #53 | Exceptional 2.0% |
| Immigrants | Korea | 99.9 /100 | #54 | Exceptional 2.0% |
| Immigrants | France | 99.9 /100 | #55 | Exceptional 2.0% |
| Immigrants | Norway | 99.9 /100 | #56 | Exceptional 2.0% |
| Burmese | 99.9 /100 | #57 | Exceptional 2.0% |
| Immigrants | Czechoslovakia | 99.9 /100 | #58 | Exceptional 2.0% |
| Immigrants | North Macedonia | 99.9 /100 | #59 | Exceptional 2.0% |
| Immigrants | Austria | 99.9 /100 | #60 | Exceptional 2.0% |
| Vietnamese | 99.9 /100 | #61 | Exceptional 2.0% |