Paraguayan vs Immigrants from Turkey Single Father Households
COMPARE
Paraguayan
Immigrants from Turkey
Single Father Households
Single Father Households Comparison
Paraguayans
Immigrants from Turkey
2.1%
SINGLE FATHER HOUSEHOLDS
99.9/ 100
METRIC RATING
65th/ 347
METRIC RANK
2.0%
SINGLE FATHER HOUSEHOLDS
100.0/ 100
METRIC RATING
41st/ 347
METRIC RANK
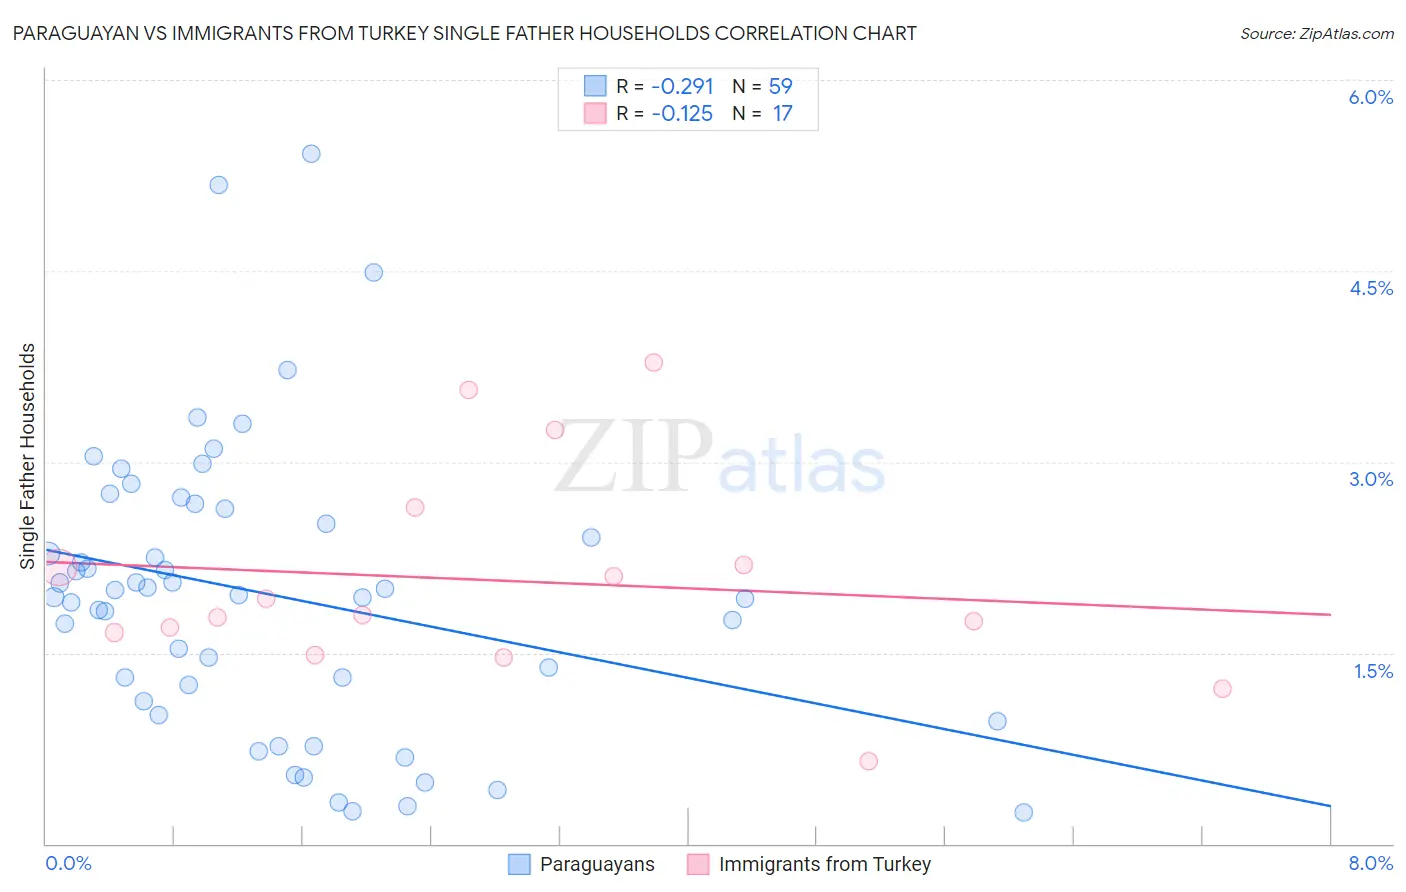
Paraguayan vs Immigrants from Turkey Single Father Households Correlation Chart
The statistical analysis conducted on geographies consisting of 94,899,584 people shows a weak negative correlation between the proportion of Paraguayans and percentage of single father households in the United States with a correlation coefficient (R) of -0.291 and weighted average of 2.1%. Similarly, the statistical analysis conducted on geographies consisting of 221,918,090 people shows a poor negative correlation between the proportion of Immigrants from Turkey and percentage of single father households in the United States with a correlation coefficient (R) of -0.125 and weighted average of 2.0%, a difference of 2.8%.
Single Father Households Correlation Summary
| Measurement | Paraguayan | Immigrants from Turkey |
| Minimum | 0.25% | 0.65% |
| Maximum | 5.4% | 3.8% |
| Range | 5.2% | 3.1% |
| Mean | 2.0% | 2.1% |
| Median | 2.0% | 1.8% |
| Interquartile 25% (IQ1) | 1.1% | 1.6% |
| Interquartile 75% (IQ3) | 2.6% | 2.4% |
| Interquartile Range (IQR) | 1.5% | 0.84% |
| Standard Deviation (Sample) | 1.1% | 0.83% |
| Standard Deviation (Population) | 1.1% | 0.80% |
Similar Demographics by Single Father Households
Demographics Similar to Paraguayans by Single Father Households
In terms of single father households, the demographic groups most similar to Paraguayans are Mongolian (2.1%, a difference of 0.030%), Maltese (2.0%, a difference of 0.17%), Immigrants from Western Asia (2.1%, a difference of 0.36%), Immigrants from Malaysia (2.0%, a difference of 0.37%), and Immigrants from Italy (2.1%, a difference of 0.41%).
| Demographics | Rating | Rank | Single Father Households |
| Immigrants | Czechoslovakia | 99.9 /100 | #58 | Exceptional 2.0% |
| Immigrants | North Macedonia | 99.9 /100 | #59 | Exceptional 2.0% |
| Immigrants | Austria | 99.9 /100 | #60 | Exceptional 2.0% |
| Vietnamese | 99.9 /100 | #61 | Exceptional 2.0% |
| Immigrants | Malaysia | 99.9 /100 | #62 | Exceptional 2.0% |
| Maltese | 99.9 /100 | #63 | Exceptional 2.0% |
| Mongolians | 99.9 /100 | #64 | Exceptional 2.1% |
| Paraguayans | 99.9 /100 | #65 | Exceptional 2.1% |
| Immigrants | Western Asia | 99.8 /100 | #66 | Exceptional 2.1% |
| Immigrants | Italy | 99.8 /100 | #67 | Exceptional 2.1% |
| Immigrants | Denmark | 99.8 /100 | #68 | Exceptional 2.1% |
| Immigrants | Romania | 99.8 /100 | #69 | Exceptional 2.1% |
| Egyptians | 99.8 /100 | #70 | Exceptional 2.1% |
| Immigrants | Kuwait | 99.8 /100 | #71 | Exceptional 2.1% |
| Immigrants | Spain | 99.8 /100 | #72 | Exceptional 2.1% |
Demographics Similar to Immigrants from Turkey by Single Father Households
In terms of single father households, the demographic groups most similar to Immigrants from Turkey are Macedonian (2.0%, a difference of 0.15%), Immigrants from Bulgaria (2.0%, a difference of 0.18%), Immigrants from Eastern Europe (2.0%, a difference of 0.23%), Immigrants from Sri Lanka (2.0%, a difference of 0.23%), and Immigrants from Grenada (2.0%, a difference of 0.38%).
| Demographics | Rating | Rank | Single Father Households |
| Immigrants | Australia | 100.0 /100 | #34 | Exceptional 2.0% |
| Albanians | 100.0 /100 | #35 | Exceptional 2.0% |
| Immigrants | Belgium | 100.0 /100 | #36 | Exceptional 2.0% |
| Immigrants | St. Vincent and the Grenadines | 100.0 /100 | #37 | Exceptional 2.0% |
| Immigrants | Eastern Europe | 100.0 /100 | #38 | Exceptional 2.0% |
| Immigrants | Sri Lanka | 100.0 /100 | #39 | Exceptional 2.0% |
| Immigrants | Bulgaria | 100.0 /100 | #40 | Exceptional 2.0% |
| Immigrants | Turkey | 100.0 /100 | #41 | Exceptional 2.0% |
| Macedonians | 100.0 /100 | #42 | Exceptional 2.0% |
| Immigrants | Grenada | 100.0 /100 | #43 | Exceptional 2.0% |
| Latvians | 100.0 /100 | #44 | Exceptional 2.0% |
| Russians | 100.0 /100 | #45 | Exceptional 2.0% |
| Immigrants | Lebanon | 100.0 /100 | #46 | Exceptional 2.0% |
| Immigrants | Ukraine | 99.9 /100 | #47 | Exceptional 2.0% |
| Immigrants | Kazakhstan | 99.9 /100 | #48 | Exceptional 2.0% |