Ukrainian vs Puget Sound Salish No Vehicles in Household
COMPARE
Ukrainian
Puget Sound Salish
No Vehicles in Household
No Vehicles in Household Comparison
Ukrainians
Puget Sound Salish
10.7%
NO VEHICLES IN HOUSEHOLD
28.0/ 100
METRIC RATING
193rd/ 347
METRIC RANK
9.5%
NO VEHICLES IN HOUSEHOLD
92.4/ 100
METRIC RATING
121st/ 347
METRIC RANK
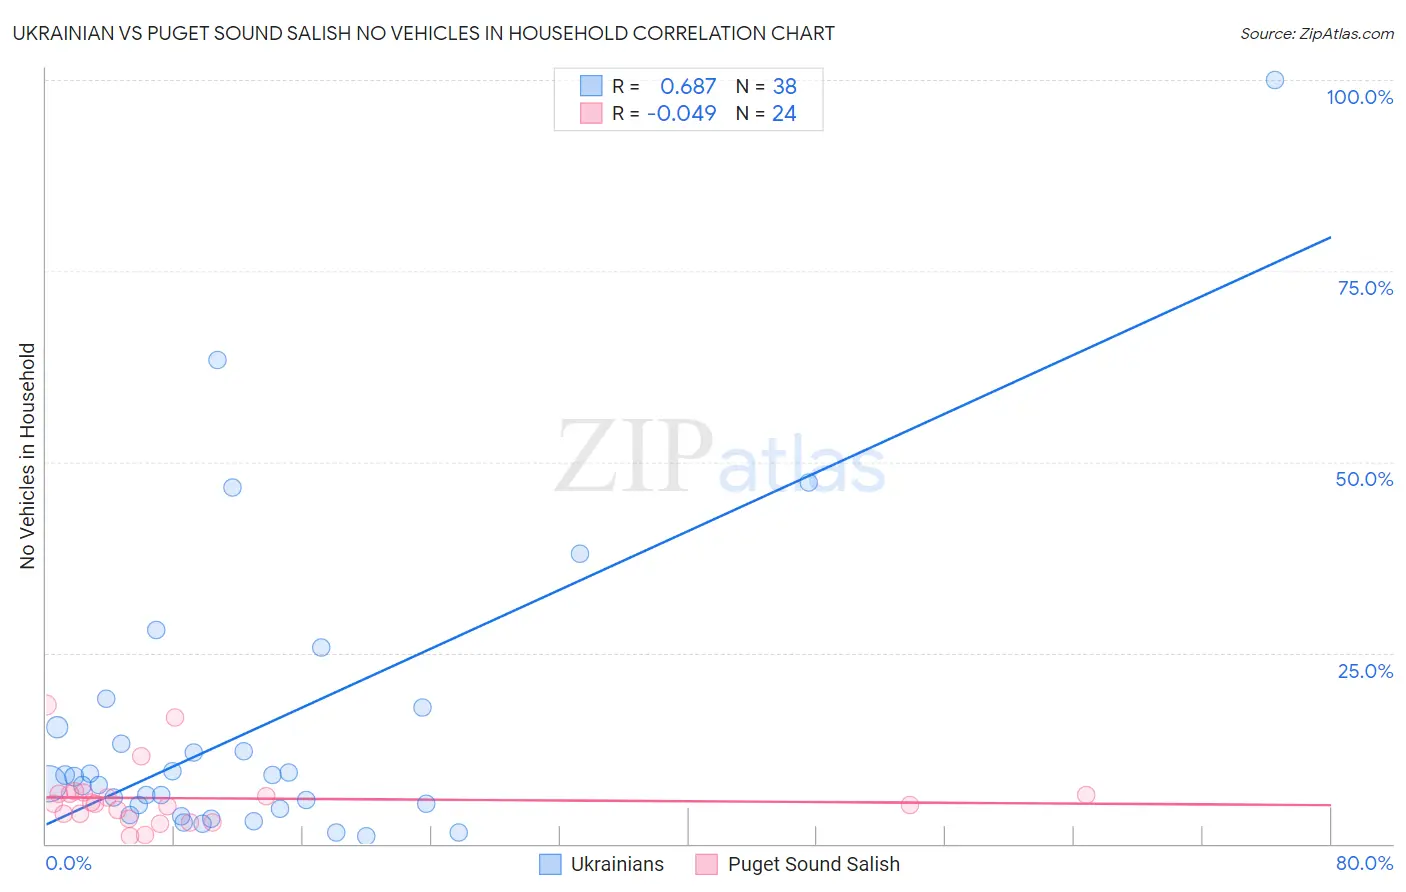
Ukrainian vs Puget Sound Salish No Vehicles in Household Correlation Chart
The statistical analysis conducted on geographies consisting of 446,891,229 people shows a significant positive correlation between the proportion of Ukrainians and percentage of households with no vehicle available in the United States with a correlation coefficient (R) of 0.687 and weighted average of 10.7%. Similarly, the statistical analysis conducted on geographies consisting of 46,140,231 people shows no correlation between the proportion of Puget Sound Salish and percentage of households with no vehicle available in the United States with a correlation coefficient (R) of -0.049 and weighted average of 9.5%, a difference of 12.7%.
No Vehicles in Household Correlation Summary
| Measurement | Ukrainian | Puget Sound Salish |
| Minimum | 1.0% | 0.96% |
| Maximum | 100.0% | 18.2% |
| Range | 99.0% | 17.3% |
| Mean | 15.2% | 6.0% |
| Median | 8.3% | 5.2% |
| Interquartile 25% (IQ1) | 4.6% | 3.5% |
| Interquartile 75% (IQ3) | 15.2% | 6.5% |
| Interquartile Range (IQR) | 10.7% | 3.0% |
| Standard Deviation (Sample) | 20.0% | 4.2% |
| Standard Deviation (Population) | 19.8% | 4.1% |
Similar Demographics by No Vehicles in Household
Demographics Similar to Ukrainians by No Vehicles in Household
In terms of no vehicles in household, the demographic groups most similar to Ukrainians are Pueblo (10.8%, a difference of 0.17%), Immigrants from Brazil (10.8%, a difference of 0.29%), Central American (10.8%, a difference of 0.63%), Carpatho Rusyn (10.7%, a difference of 0.64%), and Shoshone (10.8%, a difference of 0.67%).
| Demographics | Rating | Rank | No Vehicles in Household |
| German Russians | 40.6 /100 | #186 | Average 10.5% |
| Immigrants | Poland | 38.4 /100 | #187 | Fair 10.6% |
| Immigrants | Armenia | 37.5 /100 | #188 | Fair 10.6% |
| Immigrants | Eritrea | 36.3 /100 | #189 | Fair 10.6% |
| Immigrants | North Macedonia | 34.6 /100 | #190 | Fair 10.6% |
| Immigrants | Northern Europe | 33.1 /100 | #191 | Fair 10.7% |
| Carpatho Rusyns | 32.1 /100 | #192 | Fair 10.7% |
| Ukrainians | 28.0 /100 | #193 | Fair 10.7% |
| Pueblo | 27.0 /100 | #194 | Fair 10.8% |
| Immigrants | Brazil | 26.3 /100 | #195 | Fair 10.8% |
| Central Americans | 24.3 /100 | #196 | Fair 10.8% |
| Shoshone | 24.1 /100 | #197 | Fair 10.8% |
| Immigrants | Sweden | 22.9 /100 | #198 | Fair 10.8% |
| Immigrants | Asia | 21.3 /100 | #199 | Fair 10.9% |
| Cambodians | 19.6 /100 | #200 | Poor 10.9% |
Demographics Similar to Puget Sound Salish by No Vehicles in Household
In terms of no vehicles in household, the demographic groups most similar to Puget Sound Salish are Costa Rican (9.5%, a difference of 0.050%), Immigrants from Thailand (9.5%, a difference of 0.10%), Fijian (9.5%, a difference of 0.16%), Greek (9.5%, a difference of 0.27%), and Blackfeet (9.6%, a difference of 0.51%).
| Demographics | Rating | Rank | No Vehicles in Household |
| Serbians | 94.3 /100 | #114 | Exceptional 9.4% |
| Navajo | 94.2 /100 | #115 | Exceptional 9.4% |
| Japanese | 94.1 /100 | #116 | Exceptional 9.4% |
| Chippewa | 93.8 /100 | #117 | Exceptional 9.4% |
| Greeks | 92.9 /100 | #118 | Exceptional 9.5% |
| Fijians | 92.7 /100 | #119 | Exceptional 9.5% |
| Immigrants | Thailand | 92.6 /100 | #120 | Exceptional 9.5% |
| Puget Sound Salish | 92.4 /100 | #121 | Exceptional 9.5% |
| Costa Ricans | 92.3 /100 | #122 | Exceptional 9.5% |
| Blackfeet | 91.4 /100 | #123 | Exceptional 9.6% |
| Immigrants | Korea | 90.9 /100 | #124 | Exceptional 9.6% |
| Immigrants | Cameroon | 90.6 /100 | #125 | Exceptional 9.6% |
| Icelanders | 90.2 /100 | #126 | Exceptional 9.6% |
| Immigrants | Kenya | 89.7 /100 | #127 | Excellent 9.6% |
| Immigrants | Syria | 89.5 /100 | #128 | Excellent 9.6% |