Ukrainian vs Immigrants from Uruguay Family Households
COMPARE
Ukrainian
Immigrants from Uruguay
Family Households
Family Households Comparison
Ukrainians
Immigrants from Uruguay
64.2%
FAMILY HOUSEHOLDS
34.6/ 100
METRIC RATING
182nd/ 347
METRIC RANK
63.9%
FAMILY HOUSEHOLDS
12.8/ 100
METRIC RATING
204th/ 347
METRIC RANK
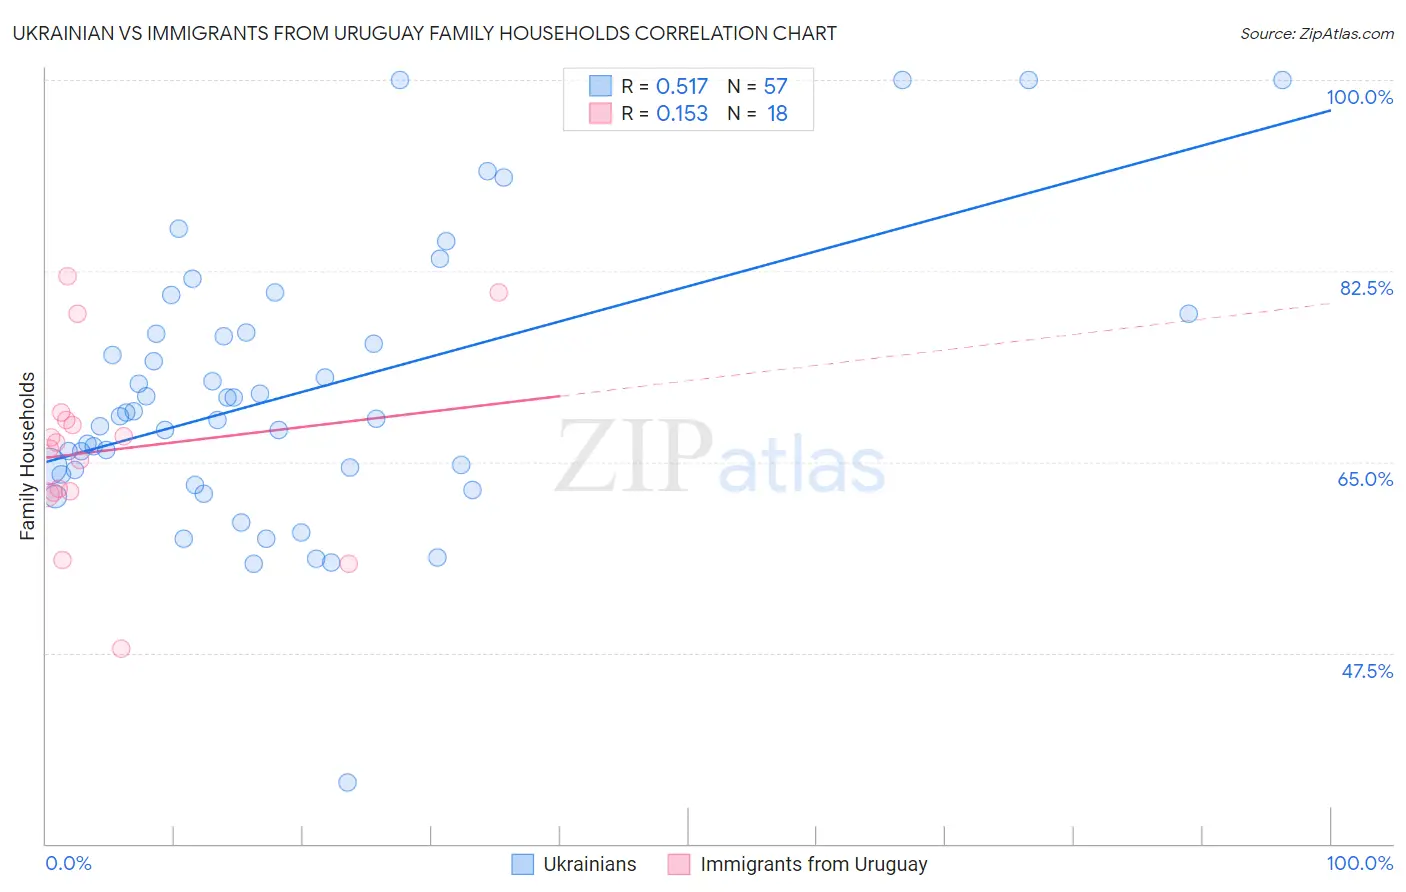
Ukrainian vs Immigrants from Uruguay Family Households Correlation Chart
The statistical analysis conducted on geographies consisting of 448,323,660 people shows a substantial positive correlation between the proportion of Ukrainians and percentage of family households in the United States with a correlation coefficient (R) of 0.517 and weighted average of 64.2%. Similarly, the statistical analysis conducted on geographies consisting of 133,245,142 people shows a poor positive correlation between the proportion of Immigrants from Uruguay and percentage of family households in the United States with a correlation coefficient (R) of 0.153 and weighted average of 63.9%, a difference of 0.43%.
Family Households Correlation Summary
| Measurement | Ukrainian | Immigrants from Uruguay |
| Minimum | 35.6% | 47.9% |
| Maximum | 100.0% | 82.0% |
| Range | 64.4% | 34.1% |
| Mean | 71.3% | 66.1% |
| Median | 69.2% | 66.5% |
| Interquartile 25% (IQ1) | 64.0% | 62.2% |
| Interquartile 75% (IQ3) | 76.8% | 68.9% |
| Interquartile Range (IQR) | 12.8% | 6.7% |
| Standard Deviation (Sample) | 12.5% | 8.6% |
| Standard Deviation (Population) | 12.4% | 8.3% |
Similar Demographics by Family Households
Demographics Similar to Ukrainians by Family Households
In terms of family households, the demographic groups most similar to Ukrainians are Immigrants from Honduras (64.2%, a difference of 0.0%), Immigrants from Trinidad and Tobago (64.2%, a difference of 0.0%), Creek (64.2%, a difference of 0.010%), Puerto Rican (64.2%, a difference of 0.020%), and Immigrants from Ukraine (64.2%, a difference of 0.050%).
| Demographics | Rating | Rank | Family Households |
| Bangladeshis | 44.3 /100 | #175 | Average 64.3% |
| Vietnamese | 43.6 /100 | #176 | Average 64.2% |
| Immigrants | Micronesia | 42.3 /100 | #177 | Average 64.2% |
| Jamaicans | 40.6 /100 | #178 | Average 64.2% |
| Immigrants | Ukraine | 38.2 /100 | #179 | Fair 64.2% |
| Immigrants | Honduras | 35.0 /100 | #180 | Fair 64.2% |
| Immigrants | Trinidad and Tobago | 34.9 /100 | #181 | Fair 64.2% |
| Ukrainians | 34.6 /100 | #182 | Fair 64.2% |
| Creek | 34.1 /100 | #183 | Fair 64.2% |
| Puerto Ricans | 33.4 /100 | #184 | Fair 64.2% |
| Immigrants | Iran | 30.4 /100 | #185 | Fair 64.1% |
| Spanish Americans | 30.1 /100 | #186 | Fair 64.1% |
| Northern Europeans | 28.2 /100 | #187 | Fair 64.1% |
| Paraguayans | 26.7 /100 | #188 | Fair 64.1% |
| Immigrants | Western Asia | 25.3 /100 | #189 | Fair 64.1% |
Demographics Similar to Immigrants from Uruguay by Family Households
In terms of family households, the demographic groups most similar to Immigrants from Uruguay are Norwegian (63.9%, a difference of 0.010%), Brazilian (63.9%, a difference of 0.010%), Iranian (63.9%, a difference of 0.020%), Immigrants from Lithuania (63.9%, a difference of 0.020%), and Nigerian (63.9%, a difference of 0.040%).
| Demographics | Rating | Rank | Family Households |
| Seminole | 18.9 /100 | #197 | Poor 64.0% |
| Poles | 18.9 /100 | #198 | Poor 64.0% |
| Slavs | 18.6 /100 | #199 | Poor 64.0% |
| Immigrants | Malaysia | 17.9 /100 | #200 | Poor 64.0% |
| Immigrants | Eastern Europe | 17.2 /100 | #201 | Poor 64.0% |
| Iranians | 13.5 /100 | #202 | Poor 63.9% |
| Norwegians | 13.2 /100 | #203 | Poor 63.9% |
| Immigrants | Uruguay | 12.8 /100 | #204 | Poor 63.9% |
| Brazilians | 12.4 /100 | #205 | Poor 63.9% |
| Immigrants | Lithuania | 12.1 /100 | #206 | Poor 63.9% |
| Nigerians | 11.5 /100 | #207 | Poor 63.9% |
| Immigrants | Bangladesh | 11.4 /100 | #208 | Poor 63.9% |
| Sierra Leoneans | 11.2 /100 | #209 | Poor 63.9% |
| Immigrants | Thailand | 9.6 /100 | #210 | Tragic 63.8% |
| Shoshone | 9.4 /100 | #211 | Tragic 63.8% |