Ukrainian vs Ugandan Divorced or Separated
COMPARE
Ukrainian
Ugandan
Divorced or Separated
Divorced or Separated Comparison
Ukrainians
Ugandans
11.8%
DIVORCED OR SEPARATED
92.3/ 100
METRIC RATING
125th/ 347
METRIC RANK
11.8%
DIVORCED OR SEPARATED
93.1/ 100
METRIC RATING
124th/ 347
METRIC RANK
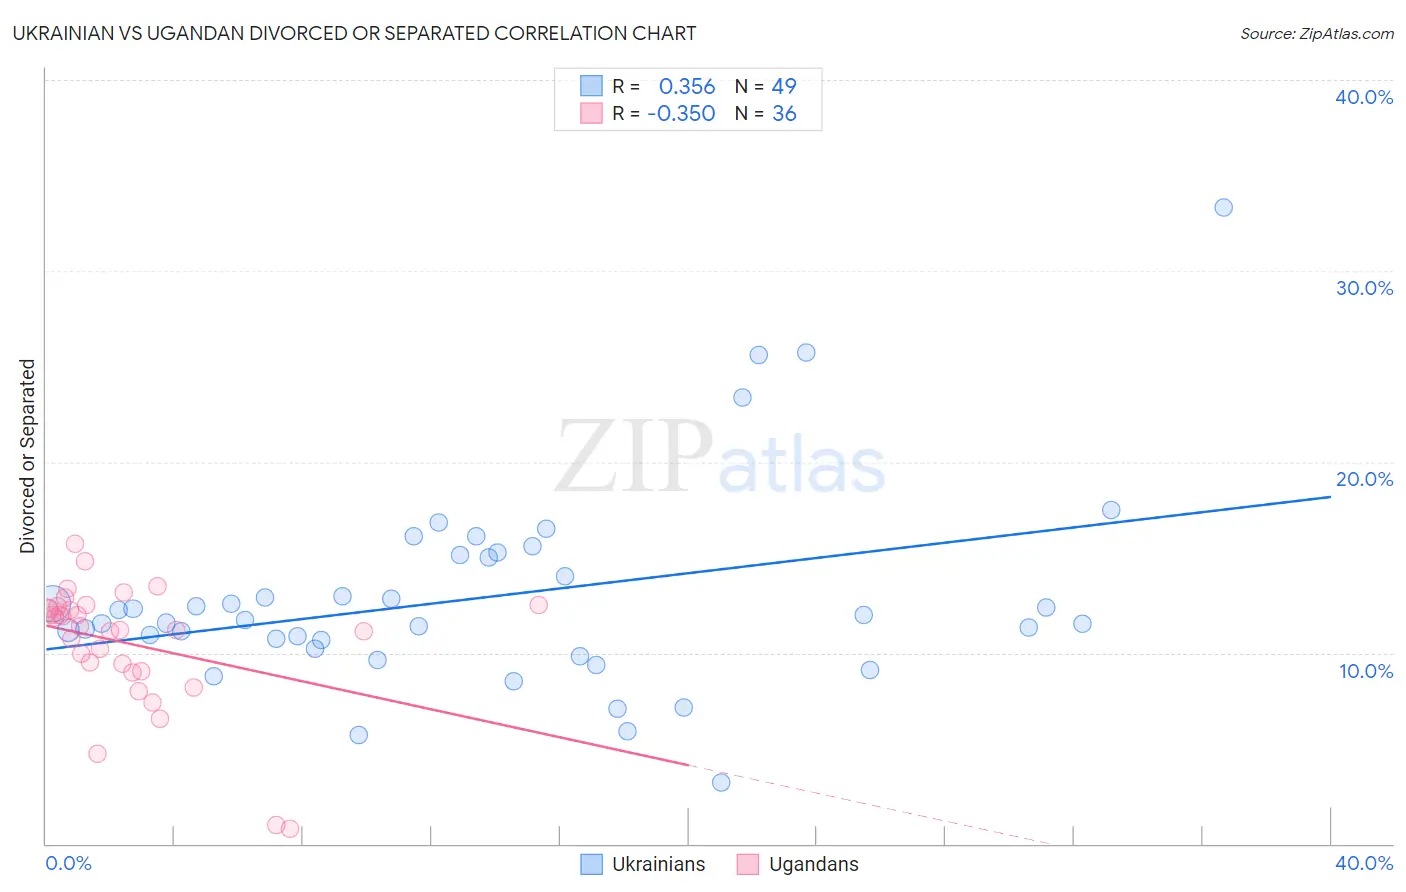
Ukrainian vs Ugandan Divorced or Separated Correlation Chart
The statistical analysis conducted on geographies consisting of 448,426,688 people shows a mild positive correlation between the proportion of Ukrainians and percentage of population currently divorced or separated in the United States with a correlation coefficient (R) of 0.356 and weighted average of 11.8%. Similarly, the statistical analysis conducted on geographies consisting of 94,013,976 people shows a mild negative correlation between the proportion of Ugandans and percentage of population currently divorced or separated in the United States with a correlation coefficient (R) of -0.350 and weighted average of 11.8%, a difference of 0.11%.
Divorced or Separated Correlation Summary
| Measurement | Ukrainian | Ugandan |
| Minimum | 3.2% | 0.80% |
| Maximum | 33.3% | 15.7% |
| Range | 30.1% | 14.9% |
| Mean | 12.9% | 10.5% |
| Median | 11.7% | 11.3% |
| Interquartile 25% (IQ1) | 10.5% | 9.2% |
| Interquartile 75% (IQ3) | 15.1% | 12.4% |
| Interquartile Range (IQR) | 4.6% | 3.1% |
| Standard Deviation (Sample) | 5.3% | 3.3% |
| Standard Deviation (Population) | 5.2% | 3.2% |
Demographics Similar to Ukrainians and Ugandans by Divorced or Separated
In terms of divorced or separated, the demographic groups most similar to Ukrainians are South American Indian (11.8%, a difference of 0.020%), Immigrants (11.8%, a difference of 0.19%), Menominee (11.8%, a difference of 0.20%), Romanian (11.8%, a difference of 0.32%), and Iraqi (11.8%, a difference of 0.34%). Similarly, the demographic groups most similar to Ugandans are Immigrants (11.8%, a difference of 0.080%), Menominee (11.8%, a difference of 0.090%), South American Indian (11.8%, a difference of 0.13%), Romanian (11.8%, a difference of 0.21%), and Iraqi (11.8%, a difference of 0.23%).
| Demographics | Rating | Rank | Divorced or Separated |
| Immigrants | Norway | 95.9 /100 | #114 | Exceptional 11.7% |
| Lithuanians | 95.7 /100 | #115 | Exceptional 11.7% |
| Immigrants | Iraq | 95.4 /100 | #116 | Exceptional 11.7% |
| Immigrants | Uganda | 95.3 /100 | #117 | Exceptional 11.7% |
| Ecuadorians | 95.3 /100 | #118 | Exceptional 11.7% |
| Syrians | 95.1 /100 | #119 | Exceptional 11.7% |
| Iraqis | 94.6 /100 | #120 | Exceptional 11.8% |
| Romanians | 94.5 /100 | #121 | Exceptional 11.8% |
| Menominee | 93.8 /100 | #122 | Exceptional 11.8% |
| Immigrants | Immigrants | 93.7 /100 | #123 | Exceptional 11.8% |
| Ugandans | 93.1 /100 | #124 | Exceptional 11.8% |
| Ukrainians | 92.3 /100 | #125 | Exceptional 11.8% |
| South American Indians | 92.1 /100 | #126 | Exceptional 11.8% |
| South Africans | 88.9 /100 | #127 | Excellent 11.8% |
| Immigrants | Ecuador | 88.9 /100 | #128 | Excellent 11.8% |
| Immigrants | St. Vincent and the Grenadines | 88.4 /100 | #129 | Excellent 11.8% |
| Immigrants | Austria | 88.2 /100 | #130 | Excellent 11.8% |
| Immigrants | Cambodia | 88.2 /100 | #131 | Excellent 11.8% |
| Immigrants | Afghanistan | 87.9 /100 | #132 | Excellent 11.8% |
| New Zealanders | 87.5 /100 | #133 | Excellent 11.9% |
| Argentineans | 85.1 /100 | #134 | Excellent 11.9% |