Ugandan vs Immigrants from Morocco Single Father Households
COMPARE
Ugandan
Immigrants from Morocco
Single Father Households
Single Father Households Comparison
Ugandans
Immigrants from Morocco
2.3%
SINGLE FATHER HOUSEHOLDS
62.2/ 100
METRIC RATING
170th/ 347
METRIC RANK
2.2%
SINGLE FATHER HOUSEHOLDS
97.8/ 100
METRIC RATING
118th/ 347
METRIC RANK
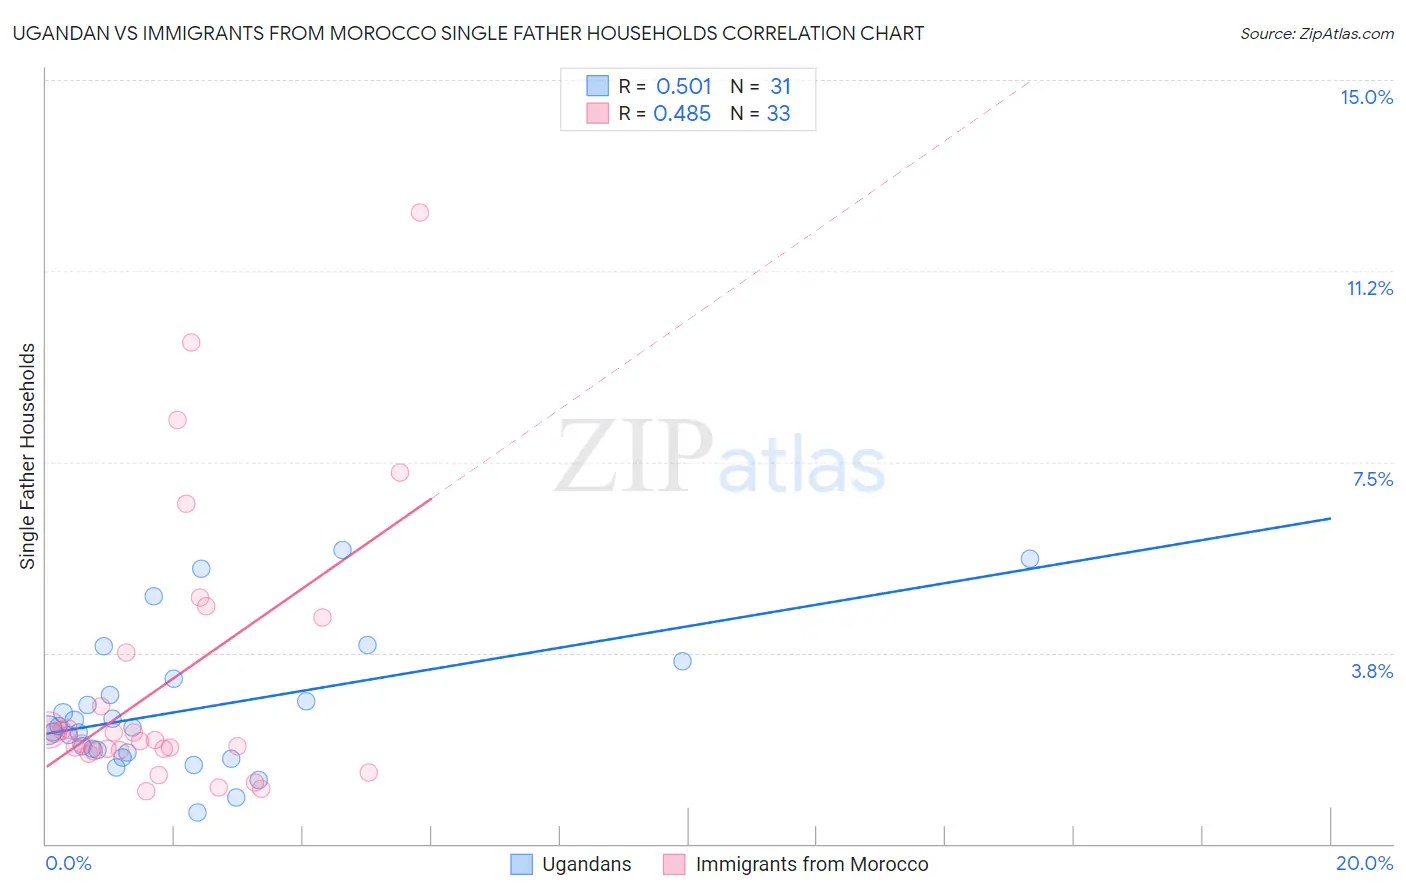
Ugandan vs Immigrants from Morocco Single Father Households Correlation Chart
The statistical analysis conducted on geographies consisting of 93,834,294 people shows a substantial positive correlation between the proportion of Ugandans and percentage of single father households in the United States with a correlation coefficient (R) of 0.501 and weighted average of 2.3%. Similarly, the statistical analysis conducted on geographies consisting of 178,475,316 people shows a moderate positive correlation between the proportion of Immigrants from Morocco and percentage of single father households in the United States with a correlation coefficient (R) of 0.485 and weighted average of 2.2%, a difference of 6.6%.
Single Father Households Correlation Summary
| Measurement | Ugandan | Immigrants from Morocco |
| Minimum | 0.61% | 1.0% |
| Maximum | 5.8% | 12.4% |
| Range | 5.2% | 11.4% |
| Mean | 2.6% | 3.2% |
| Median | 2.3% | 2.0% |
| Interquartile 25% (IQ1) | 1.8% | 1.8% |
| Interquartile 75% (IQ3) | 3.2% | 4.1% |
| Interquartile Range (IQR) | 1.4% | 2.3% |
| Standard Deviation (Sample) | 1.3% | 2.7% |
| Standard Deviation (Population) | 1.3% | 2.7% |
Similar Demographics by Single Father Households
Demographics Similar to Ugandans by Single Father Households
In terms of single father households, the demographic groups most similar to Ugandans are Czech (2.3%, a difference of 0.020%), Swedish (2.3%, a difference of 0.050%), Icelander (2.3%, a difference of 0.070%), South American (2.3%, a difference of 0.16%), and Czechoslovakian (2.3%, a difference of 0.26%).
| Demographics | Rating | Rank | Single Father Households |
| Irish | 72.1 /100 | #163 | Good 2.3% |
| Pakistanis | 70.6 /100 | #164 | Good 2.3% |
| Scotch-Irish | 69.4 /100 | #165 | Good 2.3% |
| English | 68.6 /100 | #166 | Good 2.3% |
| South Americans | 64.3 /100 | #167 | Good 2.3% |
| Icelanders | 63.1 /100 | #168 | Good 2.3% |
| Czechs | 62.5 /100 | #169 | Good 2.3% |
| Ugandans | 62.2 /100 | #170 | Good 2.3% |
| Swedes | 61.6 /100 | #171 | Good 2.3% |
| Czechoslovakians | 58.9 /100 | #172 | Average 2.3% |
| Celtics | 55.4 /100 | #173 | Average 2.3% |
| Afghans | 50.0 /100 | #174 | Average 2.3% |
| Immigrants | Jamaica | 49.1 /100 | #175 | Average 2.3% |
| Danes | 48.2 /100 | #176 | Average 2.3% |
| Colombians | 48.0 /100 | #177 | Average 2.3% |
Demographics Similar to Immigrants from Morocco by Single Father Households
In terms of single father households, the demographic groups most similar to Immigrants from Morocco are Trinidadian and Tobagonian (2.2%, a difference of 0.060%), Australian (2.2%, a difference of 0.090%), Immigrants from Brazil (2.2%, a difference of 0.090%), Hungarian (2.2%, a difference of 0.10%), and Immigrants from Iraq (2.2%, a difference of 0.19%).
| Demographics | Rating | Rank | Single Father Households |
| Immigrants | Canada | 98.3 /100 | #111 | Exceptional 2.2% |
| Immigrants | Trinidad and Tobago | 98.2 /100 | #112 | Exceptional 2.2% |
| Iraqis | 98.2 /100 | #113 | Exceptional 2.2% |
| Immigrants | North America | 98.2 /100 | #114 | Exceptional 2.2% |
| Immigrants | Barbados | 98.2 /100 | #115 | Exceptional 2.2% |
| Immigrants | Argentina | 98.1 /100 | #116 | Exceptional 2.2% |
| Hungarians | 97.9 /100 | #117 | Exceptional 2.2% |
| Immigrants | Morocco | 97.8 /100 | #118 | Exceptional 2.2% |
| Trinidadians and Tobagonians | 97.8 /100 | #119 | Exceptional 2.2% |
| Australians | 97.7 /100 | #120 | Exceptional 2.2% |
| Immigrants | Brazil | 97.7 /100 | #121 | Exceptional 2.2% |
| Immigrants | Iraq | 97.6 /100 | #122 | Exceptional 2.2% |
| Immigrants | Yemen | 97.5 /100 | #123 | Exceptional 2.2% |
| British West Indians | 97.4 /100 | #124 | Exceptional 2.2% |
| Immigrants | Indonesia | 97.4 /100 | #125 | Exceptional 2.2% |