Ugandan vs Estonian Single Father Households
COMPARE
Ugandan
Estonian
Single Father Households
Single Father Households Comparison
Ugandans
Estonians
2.3%
SINGLE FATHER HOUSEHOLDS
62.2/ 100
METRIC RATING
170th/ 347
METRIC RANK
2.1%
SINGLE FATHER HOUSEHOLDS
99.7/ 100
METRIC RATING
78th/ 347
METRIC RANK
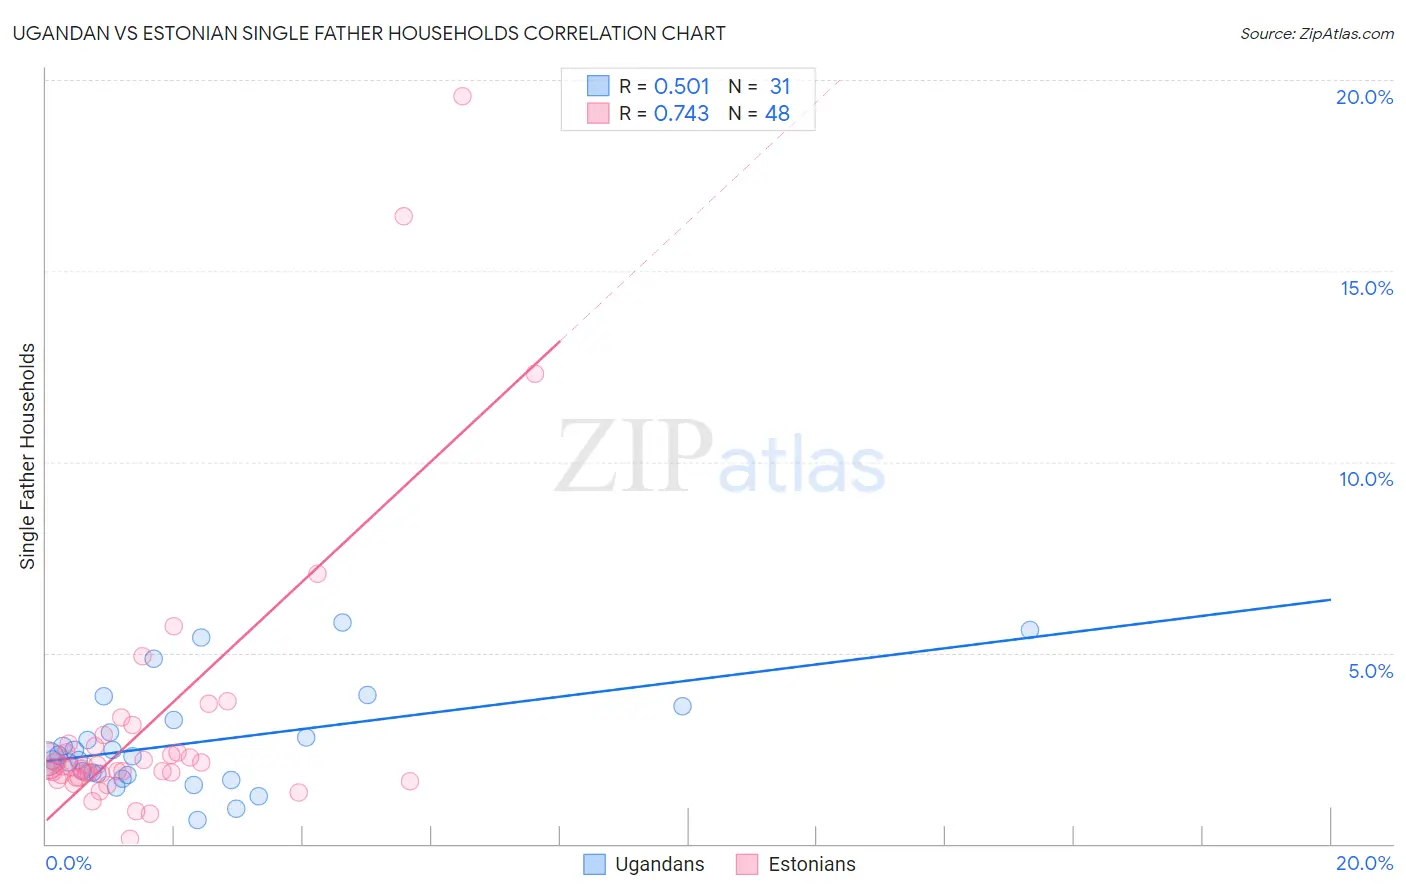
Ugandan vs Estonian Single Father Households Correlation Chart
The statistical analysis conducted on geographies consisting of 93,834,294 people shows a substantial positive correlation between the proportion of Ugandans and percentage of single father households in the United States with a correlation coefficient (R) of 0.501 and weighted average of 2.3%. Similarly, the statistical analysis conducted on geographies consisting of 123,065,759 people shows a strong positive correlation between the proportion of Estonians and percentage of single father households in the United States with a correlation coefficient (R) of 0.743 and weighted average of 2.1%, a difference of 11.2%.
Single Father Households Correlation Summary
| Measurement | Ugandan | Estonian |
| Minimum | 0.61% | 0.12% |
| Maximum | 5.8% | 19.6% |
| Range | 5.2% | 19.5% |
| Mean | 2.6% | 3.1% |
| Median | 2.3% | 2.0% |
| Interquartile 25% (IQ1) | 1.8% | 1.8% |
| Interquartile 75% (IQ3) | 3.2% | 2.6% |
| Interquartile Range (IQR) | 1.4% | 0.82% |
| Standard Deviation (Sample) | 1.3% | 3.7% |
| Standard Deviation (Population) | 1.3% | 3.6% |
Similar Demographics by Single Father Households
Demographics Similar to Ugandans by Single Father Households
In terms of single father households, the demographic groups most similar to Ugandans are Czech (2.3%, a difference of 0.020%), Swedish (2.3%, a difference of 0.050%), Icelander (2.3%, a difference of 0.070%), South American (2.3%, a difference of 0.16%), and Czechoslovakian (2.3%, a difference of 0.26%).
| Demographics | Rating | Rank | Single Father Households |
| Irish | 72.1 /100 | #163 | Good 2.3% |
| Pakistanis | 70.6 /100 | #164 | Good 2.3% |
| Scotch-Irish | 69.4 /100 | #165 | Good 2.3% |
| English | 68.6 /100 | #166 | Good 2.3% |
| South Americans | 64.3 /100 | #167 | Good 2.3% |
| Icelanders | 63.1 /100 | #168 | Good 2.3% |
| Czechs | 62.5 /100 | #169 | Good 2.3% |
| Ugandans | 62.2 /100 | #170 | Good 2.3% |
| Swedes | 61.6 /100 | #171 | Good 2.3% |
| Czechoslovakians | 58.9 /100 | #172 | Average 2.3% |
| Celtics | 55.4 /100 | #173 | Average 2.3% |
| Afghans | 50.0 /100 | #174 | Average 2.3% |
| Immigrants | Jamaica | 49.1 /100 | #175 | Average 2.3% |
| Danes | 48.2 /100 | #176 | Average 2.3% |
| Colombians | 48.0 /100 | #177 | Average 2.3% |
Demographics Similar to Estonians by Single Father Households
In terms of single father households, the demographic groups most similar to Estonians are Immigrants from Asia (2.1%, a difference of 0.11%), Immigrants from South Africa (2.1%, a difference of 0.20%), Armenian (2.1%, a difference of 0.28%), Immigrants from Saudi Arabia (2.1%, a difference of 0.31%), and New Zealander (2.1%, a difference of 0.33%).
| Demographics | Rating | Rank | Single Father Households |
| Immigrants | Kuwait | 99.8 /100 | #71 | Exceptional 2.1% |
| Immigrants | Spain | 99.8 /100 | #72 | Exceptional 2.1% |
| Immigrants | Bangladesh | 99.8 /100 | #73 | Exceptional 2.1% |
| Immigrants | Egypt | 99.8 /100 | #74 | Exceptional 2.1% |
| Immigrants | Sweden | 99.8 /100 | #75 | Exceptional 2.1% |
| Immigrants | Scotland | 99.8 /100 | #76 | Exceptional 2.1% |
| Immigrants | Saudi Arabia | 99.8 /100 | #77 | Exceptional 2.1% |
| Estonians | 99.7 /100 | #78 | Exceptional 2.1% |
| Immigrants | Asia | 99.7 /100 | #79 | Exceptional 2.1% |
| Immigrants | South Africa | 99.7 /100 | #80 | Exceptional 2.1% |
| Armenians | 99.7 /100 | #81 | Exceptional 2.1% |
| New Zealanders | 99.7 /100 | #82 | Exceptional 2.1% |
| Greeks | 99.7 /100 | #83 | Exceptional 2.1% |
| Carpatho Rusyns | 99.6 /100 | #84 | Exceptional 2.1% |
| Immigrants | Hungary | 99.6 /100 | #85 | Exceptional 2.1% |