Immigrants from Belgium vs Immigrants from Morocco Single Father Households
COMPARE
Immigrants from Belgium
Immigrants from Morocco
Single Father Households
Single Father Households Comparison
Immigrants from Belgium
Immigrants from Morocco
2.0%
SINGLE FATHER HOUSEHOLDS
100.0/ 100
METRIC RATING
36th/ 347
METRIC RANK
2.2%
SINGLE FATHER HOUSEHOLDS
97.8/ 100
METRIC RATING
118th/ 347
METRIC RANK
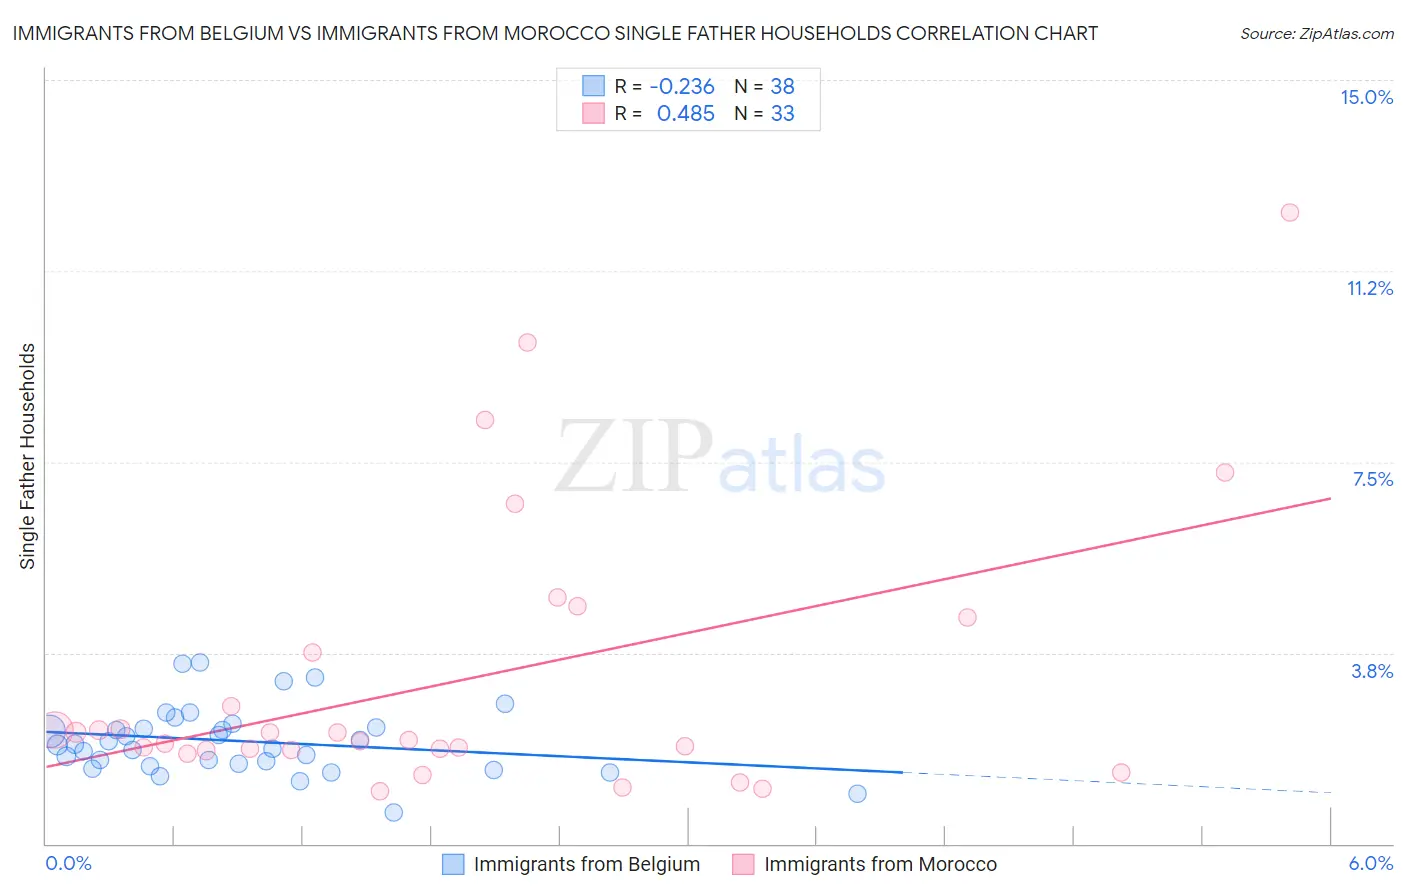
Immigrants from Belgium vs Immigrants from Morocco Single Father Households Correlation Chart
The statistical analysis conducted on geographies consisting of 146,023,758 people shows a weak negative correlation between the proportion of Immigrants from Belgium and percentage of single father households in the United States with a correlation coefficient (R) of -0.236 and weighted average of 2.0%. Similarly, the statistical analysis conducted on geographies consisting of 178,475,316 people shows a moderate positive correlation between the proportion of Immigrants from Morocco and percentage of single father households in the United States with a correlation coefficient (R) of 0.485 and weighted average of 2.2%, a difference of 9.5%.
Single Father Households Correlation Summary
| Measurement | Immigrants from Belgium | Immigrants from Morocco |
| Minimum | 0.62% | 1.0% |
| Maximum | 3.6% | 12.4% |
| Range | 2.9% | 11.4% |
| Mean | 2.0% | 3.2% |
| Median | 2.0% | 2.0% |
| Interquartile 25% (IQ1) | 1.6% | 1.8% |
| Interquartile 75% (IQ3) | 2.3% | 4.1% |
| Interquartile Range (IQR) | 0.71% | 2.3% |
| Standard Deviation (Sample) | 0.66% | 2.7% |
| Standard Deviation (Population) | 0.65% | 2.7% |
Similar Demographics by Single Father Households
Demographics Similar to Immigrants from Belgium by Single Father Households
In terms of single father households, the demographic groups most similar to Immigrants from Belgium are Immigrants from St. Vincent and the Grenadines (2.0%, a difference of 0.020%), Albanian (2.0%, a difference of 0.11%), Immigrants from Eastern Europe (2.0%, a difference of 0.32%), Immigrants from Sri Lanka (2.0%, a difference of 0.32%), and Immigrants from Bulgaria (2.0%, a difference of 0.37%).
| Demographics | Rating | Rank | Single Father Households |
| Bulgarians | 100.0 /100 | #29 | Exceptional 2.0% |
| Cambodians | 100.0 /100 | #30 | Exceptional 2.0% |
| Israelis | 100.0 /100 | #31 | Exceptional 2.0% |
| Chinese | 100.0 /100 | #32 | Exceptional 2.0% |
| Turks | 100.0 /100 | #33 | Exceptional 2.0% |
| Immigrants | Australia | 100.0 /100 | #34 | Exceptional 2.0% |
| Albanians | 100.0 /100 | #35 | Exceptional 2.0% |
| Immigrants | Belgium | 100.0 /100 | #36 | Exceptional 2.0% |
| Immigrants | St. Vincent and the Grenadines | 100.0 /100 | #37 | Exceptional 2.0% |
| Immigrants | Eastern Europe | 100.0 /100 | #38 | Exceptional 2.0% |
| Immigrants | Sri Lanka | 100.0 /100 | #39 | Exceptional 2.0% |
| Immigrants | Bulgaria | 100.0 /100 | #40 | Exceptional 2.0% |
| Immigrants | Turkey | 100.0 /100 | #41 | Exceptional 2.0% |
| Macedonians | 100.0 /100 | #42 | Exceptional 2.0% |
| Immigrants | Grenada | 100.0 /100 | #43 | Exceptional 2.0% |
Demographics Similar to Immigrants from Morocco by Single Father Households
In terms of single father households, the demographic groups most similar to Immigrants from Morocco are Trinidadian and Tobagonian (2.2%, a difference of 0.060%), Australian (2.2%, a difference of 0.090%), Immigrants from Brazil (2.2%, a difference of 0.090%), Hungarian (2.2%, a difference of 0.10%), and Immigrants from Iraq (2.2%, a difference of 0.19%).
| Demographics | Rating | Rank | Single Father Households |
| Immigrants | Canada | 98.3 /100 | #111 | Exceptional 2.2% |
| Immigrants | Trinidad and Tobago | 98.2 /100 | #112 | Exceptional 2.2% |
| Iraqis | 98.2 /100 | #113 | Exceptional 2.2% |
| Immigrants | North America | 98.2 /100 | #114 | Exceptional 2.2% |
| Immigrants | Barbados | 98.2 /100 | #115 | Exceptional 2.2% |
| Immigrants | Argentina | 98.1 /100 | #116 | Exceptional 2.2% |
| Hungarians | 97.9 /100 | #117 | Exceptional 2.2% |
| Immigrants | Morocco | 97.8 /100 | #118 | Exceptional 2.2% |
| Trinidadians and Tobagonians | 97.8 /100 | #119 | Exceptional 2.2% |
| Australians | 97.7 /100 | #120 | Exceptional 2.2% |
| Immigrants | Brazil | 97.7 /100 | #121 | Exceptional 2.2% |
| Immigrants | Iraq | 97.6 /100 | #122 | Exceptional 2.2% |
| Immigrants | Yemen | 97.5 /100 | #123 | Exceptional 2.2% |
| British West Indians | 97.4 /100 | #124 | Exceptional 2.2% |
| Immigrants | Indonesia | 97.4 /100 | #125 | Exceptional 2.2% |