Ugandan vs Bahamian Single Mother Households
COMPARE
Ugandan
Bahamian
Single Mother Households
Single Mother Households Comparison
Ugandans
Bahamians
6.5%
SINGLE MOTHER HOUSEHOLDS
25.6/ 100
METRIC RATING
185th/ 347
METRIC RANK
8.3%
SINGLE MOTHER HOUSEHOLDS
0.0/ 100
METRIC RATING
320th/ 347
METRIC RANK
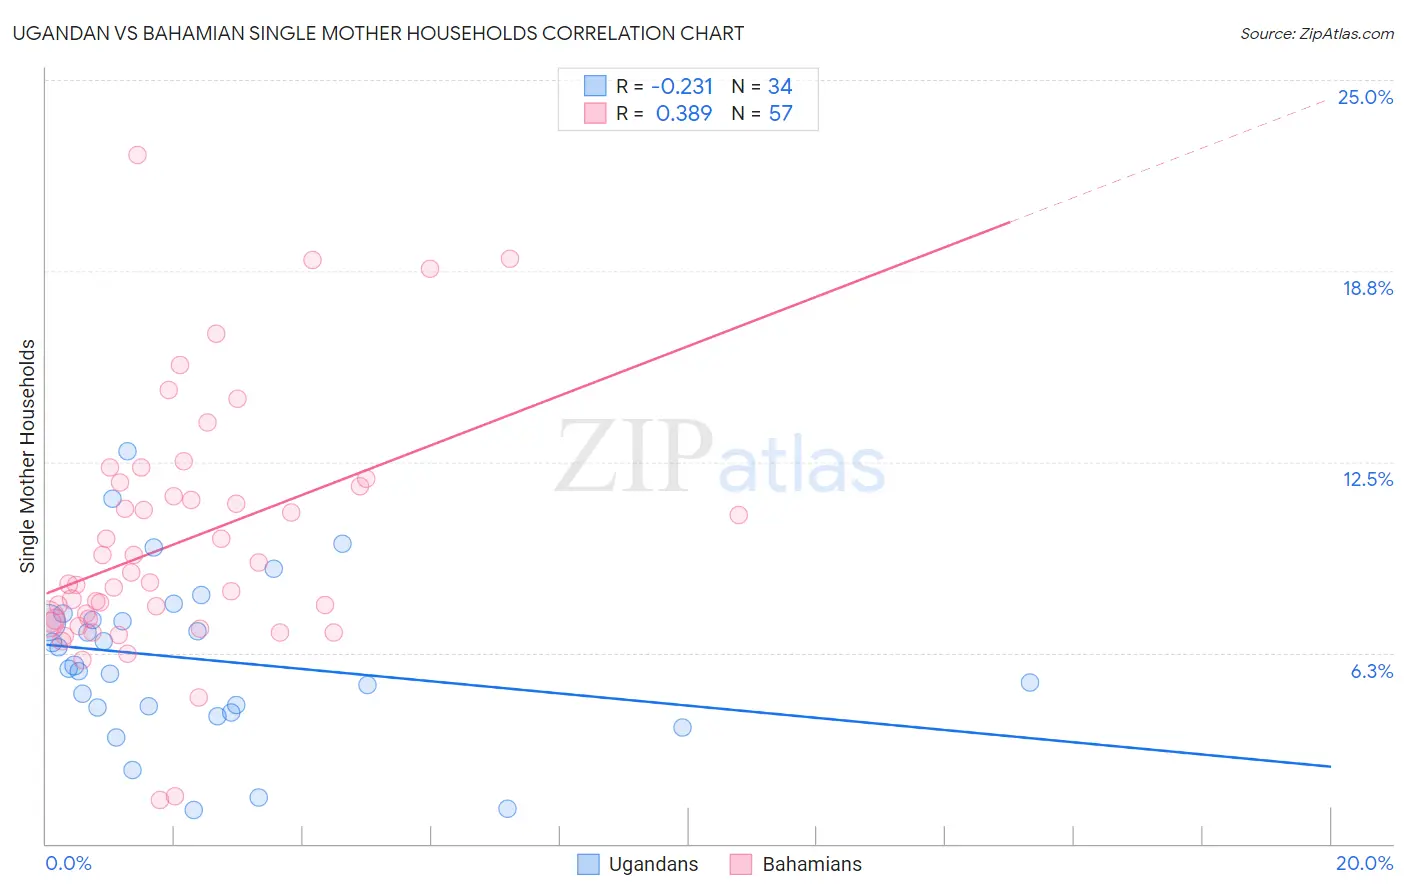
Ugandan vs Bahamian Single Mother Households Correlation Chart
The statistical analysis conducted on geographies consisting of 93,972,955 people shows a weak negative correlation between the proportion of Ugandans and percentage of single mother households in the United States with a correlation coefficient (R) of -0.231 and weighted average of 6.5%. Similarly, the statistical analysis conducted on geographies consisting of 112,454,075 people shows a mild positive correlation between the proportion of Bahamians and percentage of single mother households in the United States with a correlation coefficient (R) of 0.389 and weighted average of 8.3%, a difference of 27.1%.
Single Mother Households Correlation Summary
| Measurement | Ugandan | Bahamian |
| Minimum | 1.1% | 1.4% |
| Maximum | 12.8% | 22.6% |
| Range | 11.7% | 21.1% |
| Mean | 6.0% | 9.9% |
| Median | 5.8% | 8.5% |
| Interquartile 25% (IQ1) | 4.5% | 7.3% |
| Interquartile 75% (IQ3) | 7.3% | 11.8% |
| Interquartile Range (IQR) | 2.9% | 4.5% |
| Standard Deviation (Sample) | 2.7% | 4.1% |
| Standard Deviation (Population) | 2.6% | 4.0% |
Similar Demographics by Single Mother Households
Demographics Similar to Ugandans by Single Mother Households
In terms of single mother households, the demographic groups most similar to Ugandans are Ethiopian (6.5%, a difference of 0.060%), Costa Rican (6.5%, a difference of 0.11%), Immigrants from Afghanistan (6.5%, a difference of 0.13%), Ottawa (6.5%, a difference of 0.26%), and Spaniard (6.5%, a difference of 0.30%).
| Demographics | Rating | Rank | Single Mother Households |
| Portuguese | 40.0 /100 | #178 | Fair 6.4% |
| Hmong | 39.8 /100 | #179 | Fair 6.4% |
| Immigrants | Nepal | 36.1 /100 | #180 | Fair 6.4% |
| Spanish | 33.4 /100 | #181 | Fair 6.4% |
| South American Indians | 33.4 /100 | #182 | Fair 6.4% |
| Spaniards | 27.8 /100 | #183 | Fair 6.5% |
| Ethiopians | 26.0 /100 | #184 | Fair 6.5% |
| Ugandans | 25.6 /100 | #185 | Fair 6.5% |
| Costa Ricans | 24.8 /100 | #186 | Fair 6.5% |
| Immigrants | Afghanistan | 24.7 /100 | #187 | Fair 6.5% |
| Ottawa | 23.8 /100 | #188 | Fair 6.5% |
| Delaware | 23.3 /100 | #189 | Fair 6.5% |
| Peruvians | 21.6 /100 | #190 | Fair 6.5% |
| Samoans | 21.2 /100 | #191 | Fair 6.5% |
| Americans | 19.0 /100 | #192 | Poor 6.6% |
Demographics Similar to Bahamians by Single Mother Households
In terms of single mother households, the demographic groups most similar to Bahamians are Jamaican (8.2%, a difference of 0.12%), Senegalese (8.2%, a difference of 0.23%), Immigrants from Senegal (8.3%, a difference of 0.24%), Pima (8.3%, a difference of 0.32%), and Immigrants from Honduras (8.2%, a difference of 0.80%).
| Demographics | Rating | Rank | Single Mother Households |
| Immigrants | Grenada | 0.0 /100 | #313 | Tragic 8.2% |
| Immigrants | Mexico | 0.0 /100 | #314 | Tragic 8.2% |
| Immigrants | Western Africa | 0.0 /100 | #315 | Tragic 8.2% |
| Africans | 0.0 /100 | #316 | Tragic 8.2% |
| Immigrants | Honduras | 0.0 /100 | #317 | Tragic 8.2% |
| Senegalese | 0.0 /100 | #318 | Tragic 8.2% |
| Jamaicans | 0.0 /100 | #319 | Tragic 8.2% |
| Bahamians | 0.0 /100 | #320 | Tragic 8.3% |
| Immigrants | Senegal | 0.0 /100 | #321 | Tragic 8.3% |
| Pima | 0.0 /100 | #322 | Tragic 8.3% |
| Haitians | 0.0 /100 | #323 | Tragic 8.3% |
| Immigrants | Jamaica | 0.0 /100 | #324 | Tragic 8.4% |
| Immigrants | Caribbean | 0.0 /100 | #325 | Tragic 8.4% |
| British West Indians | 0.0 /100 | #326 | Tragic 8.4% |
| Immigrants | Haiti | 0.0 /100 | #327 | Tragic 8.4% |