Ugandan vs Immigrants from India Single Mother Households
COMPARE
Ugandan
Immigrants from India
Single Mother Households
Single Mother Households Comparison
Ugandans
Immigrants from India
6.5%
SINGLE MOTHER HOUSEHOLDS
25.6/ 100
METRIC RATING
185th/ 347
METRIC RANK
5.1%
SINGLE MOTHER HOUSEHOLDS
99.9/ 100
METRIC RATING
13th/ 347
METRIC RANK
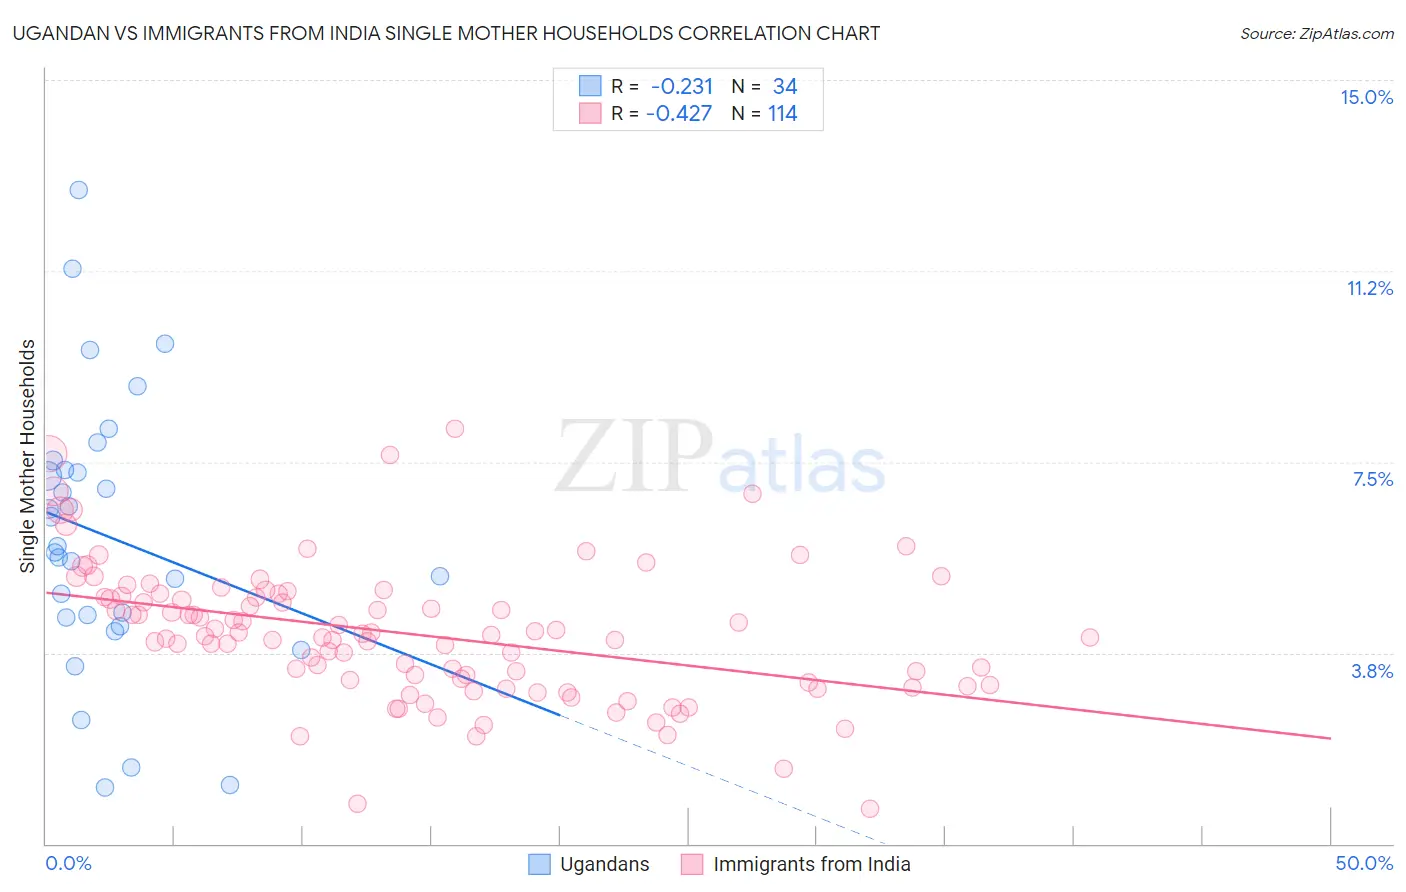
Ugandan vs Immigrants from India Single Mother Households Correlation Chart
The statistical analysis conducted on geographies consisting of 93,972,955 people shows a weak negative correlation between the proportion of Ugandans and percentage of single mother households in the United States with a correlation coefficient (R) of -0.231 and weighted average of 6.5%. Similarly, the statistical analysis conducted on geographies consisting of 432,741,319 people shows a moderate negative correlation between the proportion of Immigrants from India and percentage of single mother households in the United States with a correlation coefficient (R) of -0.427 and weighted average of 5.1%, a difference of 28.0%.
Single Mother Households Correlation Summary
| Measurement | Ugandan | Immigrants from India |
| Minimum | 1.1% | 0.68% |
| Maximum | 12.8% | 8.1% |
| Range | 11.7% | 7.5% |
| Mean | 6.0% | 4.1% |
| Median | 5.8% | 4.1% |
| Interquartile 25% (IQ1) | 4.5% | 3.2% |
| Interquartile 75% (IQ3) | 7.3% | 4.9% |
| Interquartile Range (IQR) | 2.9% | 1.7% |
| Standard Deviation (Sample) | 2.7% | 1.3% |
| Standard Deviation (Population) | 2.6% | 1.3% |
Similar Demographics by Single Mother Households
Demographics Similar to Ugandans by Single Mother Households
In terms of single mother households, the demographic groups most similar to Ugandans are Ethiopian (6.5%, a difference of 0.060%), Costa Rican (6.5%, a difference of 0.11%), Immigrants from Afghanistan (6.5%, a difference of 0.13%), Ottawa (6.5%, a difference of 0.26%), and Spaniard (6.5%, a difference of 0.30%).
| Demographics | Rating | Rank | Single Mother Households |
| Portuguese | 40.0 /100 | #178 | Fair 6.4% |
| Hmong | 39.8 /100 | #179 | Fair 6.4% |
| Immigrants | Nepal | 36.1 /100 | #180 | Fair 6.4% |
| Spanish | 33.4 /100 | #181 | Fair 6.4% |
| South American Indians | 33.4 /100 | #182 | Fair 6.4% |
| Spaniards | 27.8 /100 | #183 | Fair 6.5% |
| Ethiopians | 26.0 /100 | #184 | Fair 6.5% |
| Ugandans | 25.6 /100 | #185 | Fair 6.5% |
| Costa Ricans | 24.8 /100 | #186 | Fair 6.5% |
| Immigrants | Afghanistan | 24.7 /100 | #187 | Fair 6.5% |
| Ottawa | 23.8 /100 | #188 | Fair 6.5% |
| Delaware | 23.3 /100 | #189 | Fair 6.5% |
| Peruvians | 21.6 /100 | #190 | Fair 6.5% |
| Samoans | 21.2 /100 | #191 | Fair 6.5% |
| Americans | 19.0 /100 | #192 | Poor 6.6% |
Demographics Similar to Immigrants from India by Single Mother Households
In terms of single mother households, the demographic groups most similar to Immigrants from India are Cypriot (5.1%, a difference of 0.12%), Immigrants from China (5.1%, a difference of 0.30%), Immigrants from Australia (5.1%, a difference of 0.32%), Immigrants from Eastern Asia (5.1%, a difference of 0.42%), and Indian (Asian) (5.1%, a difference of 0.60%).
| Demographics | Rating | Rank | Single Mother Households |
| Immigrants | Singapore | 100.0 /100 | #6 | Exceptional 5.0% |
| Iranians | 100.0 /100 | #7 | Exceptional 5.0% |
| Immigrants | Ireland | 99.9 /100 | #8 | Exceptional 5.0% |
| Okinawans | 99.9 /100 | #9 | Exceptional 5.0% |
| Immigrants | Israel | 99.9 /100 | #10 | Exceptional 5.0% |
| Immigrants | China | 99.9 /100 | #11 | Exceptional 5.1% |
| Cypriots | 99.9 /100 | #12 | Exceptional 5.1% |
| Immigrants | India | 99.9 /100 | #13 | Exceptional 5.1% |
| Immigrants | Australia | 99.9 /100 | #14 | Exceptional 5.1% |
| Immigrants | Eastern Asia | 99.9 /100 | #15 | Exceptional 5.1% |
| Indians (Asian) | 99.9 /100 | #16 | Exceptional 5.1% |
| Soviet Union | 99.9 /100 | #17 | Exceptional 5.1% |
| Immigrants | Armenia | 99.9 /100 | #18 | Exceptional 5.2% |
| Chinese | 99.9 /100 | #19 | Exceptional 5.2% |
| Maltese | 99.9 /100 | #20 | Exceptional 5.2% |