Immigrants from Middle Africa vs Bolivian Single Father Households
COMPARE
Immigrants from Middle Africa
Bolivian
Single Father Households
Single Father Households Comparison
Immigrants from Middle Africa
Bolivians
2.5%
SINGLE FATHER HOUSEHOLDS
2.8/ 100
METRIC RATING
244th/ 347
METRIC RANK
2.3%
SINGLE FATHER HOUSEHOLDS
81.0/ 100
METRIC RATING
154th/ 347
METRIC RANK
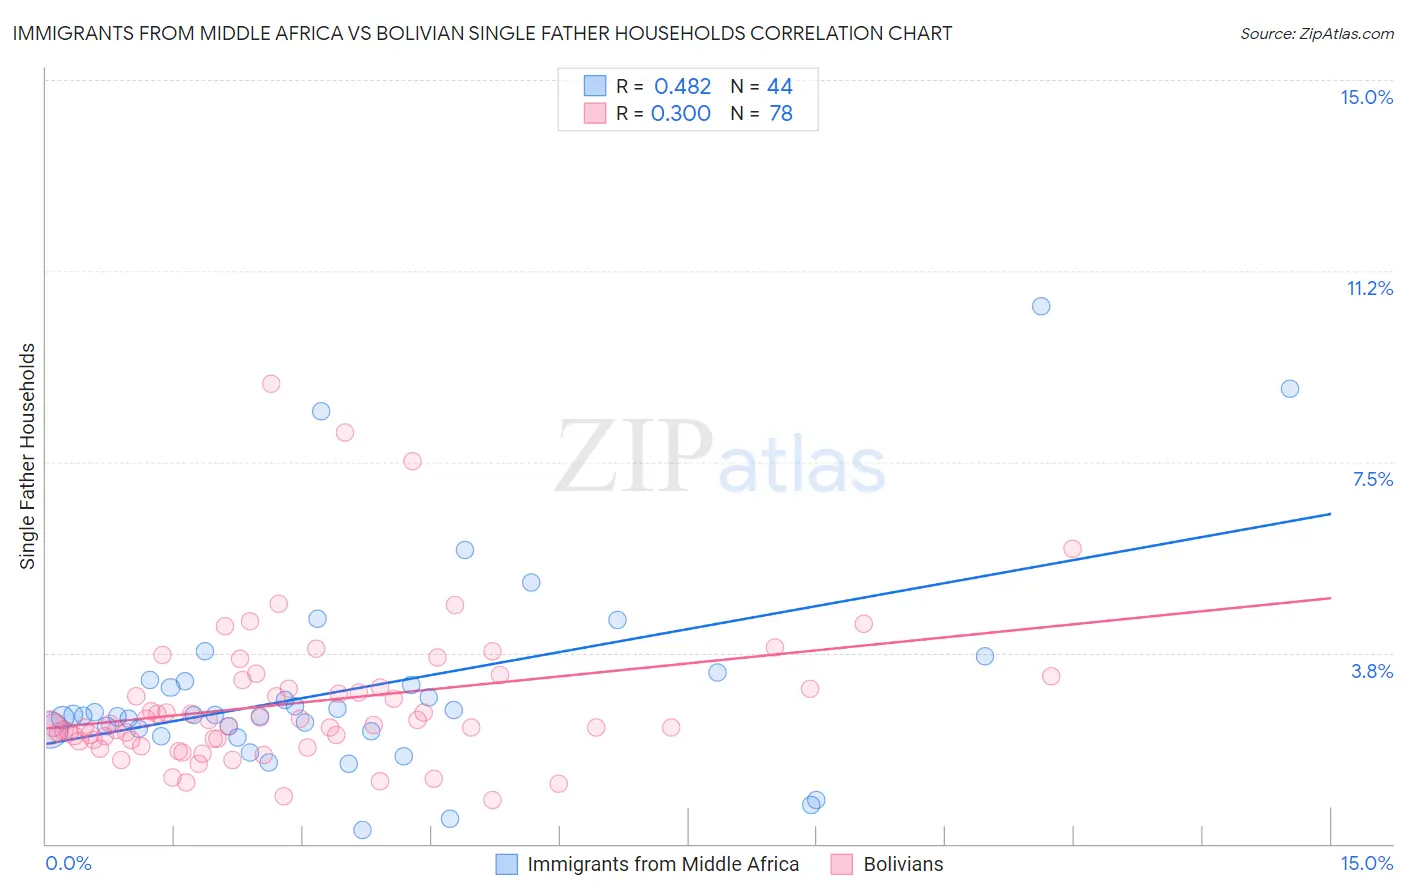
Immigrants from Middle Africa vs Bolivian Single Father Households Correlation Chart
The statistical analysis conducted on geographies consisting of 202,115,856 people shows a moderate positive correlation between the proportion of Immigrants from Middle Africa and percentage of single father households in the United States with a correlation coefficient (R) of 0.482 and weighted average of 2.5%. Similarly, the statistical analysis conducted on geographies consisting of 184,110,694 people shows a mild positive correlation between the proportion of Bolivians and percentage of single father households in the United States with a correlation coefficient (R) of 0.300 and weighted average of 2.3%, a difference of 9.4%.
Single Father Households Correlation Summary
| Measurement | Immigrants from Middle Africa | Bolivian |
| Minimum | 0.27% | 0.87% |
| Maximum | 10.6% | 9.0% |
| Range | 10.3% | 8.2% |
| Mean | 3.1% | 2.8% |
| Median | 2.5% | 2.3% |
| Interquartile 25% (IQ1) | 2.2% | 2.0% |
| Interquartile 75% (IQ3) | 3.2% | 3.1% |
| Interquartile Range (IQR) | 0.98% | 1.0% |
| Standard Deviation (Sample) | 2.0% | 1.4% |
| Standard Deviation (Population) | 2.0% | 1.4% |
Similar Demographics by Single Father Households
Demographics Similar to Immigrants from Middle Africa by Single Father Households
In terms of single father households, the demographic groups most similar to Immigrants from Middle Africa are Spaniard (2.5%, a difference of 0.19%), Basque (2.5%, a difference of 0.21%), Native Hawaiian (2.5%, a difference of 0.23%), Delaware (2.5%, a difference of 0.24%), and Bahamian (2.5%, a difference of 0.28%).
| Demographics | Rating | Rank | Single Father Households |
| Sierra Leoneans | 5.9 /100 | #237 | Tragic 2.5% |
| Immigrants | Sierra Leone | 5.8 /100 | #238 | Tragic 2.5% |
| Immigrants | Oceania | 5.8 /100 | #239 | Tragic 2.5% |
| Immigrants | Dominica | 4.8 /100 | #240 | Tragic 2.5% |
| Portuguese | 4.1 /100 | #241 | Tragic 2.5% |
| Osage | 4.1 /100 | #242 | Tragic 2.5% |
| Spaniards | 3.1 /100 | #243 | Tragic 2.5% |
| Immigrants | Middle Africa | 2.8 /100 | #244 | Tragic 2.5% |
| Basques | 2.5 /100 | #245 | Tragic 2.5% |
| Native Hawaiians | 2.5 /100 | #246 | Tragic 2.5% |
| Delaware | 2.5 /100 | #247 | Tragic 2.5% |
| Bahamians | 2.4 /100 | #248 | Tragic 2.5% |
| Immigrants | Cameroon | 2.3 /100 | #249 | Tragic 2.5% |
| Somalis | 2.1 /100 | #250 | Tragic 2.5% |
| Liberians | 2.0 /100 | #251 | Tragic 2.5% |
Demographics Similar to Bolivians by Single Father Households
In terms of single father households, the demographic groups most similar to Bolivians are European (2.3%, a difference of 0.020%), Immigrants from South America (2.3%, a difference of 0.14%), Canadian (2.3%, a difference of 0.16%), Immigrants from Senegal (2.3%, a difference of 0.19%), and Immigrants from Germany (2.3%, a difference of 0.22%).
| Demographics | Rating | Rank | Single Father Households |
| Slavs | 88.9 /100 | #147 | Excellent 2.2% |
| South American Indians | 88.5 /100 | #148 | Excellent 2.3% |
| Senegalese | 88.4 /100 | #149 | Excellent 2.3% |
| Venezuelans | 86.2 /100 | #150 | Excellent 2.3% |
| Immigrants | Syria | 84.8 /100 | #151 | Excellent 2.3% |
| Immigrants | Venezuela | 83.2 /100 | #152 | Excellent 2.3% |
| Immigrants | Germany | 82.8 /100 | #153 | Excellent 2.3% |
| Bolivians | 81.0 /100 | #154 | Excellent 2.3% |
| Europeans | 80.9 /100 | #155 | Excellent 2.3% |
| Immigrants | South America | 79.9 /100 | #156 | Good 2.3% |
| Canadians | 79.7 /100 | #157 | Good 2.3% |
| Immigrants | Senegal | 79.4 /100 | #158 | Good 2.3% |
| Immigrants | West Indies | 77.9 /100 | #159 | Good 2.3% |
| Immigrants | Bolivia | 76.3 /100 | #160 | Good 2.3% |
| Swiss | 73.2 /100 | #161 | Good 2.3% |