Immigrants from Albania vs Bolivian Single Father Households
COMPARE
Immigrants from Albania
Bolivian
Single Father Households
Single Father Households Comparison
Immigrants from Albania
Bolivians
1.9%
SINGLE FATHER HOUSEHOLDS
100.0/ 100
METRIC RATING
21st/ 347
METRIC RANK
2.3%
SINGLE FATHER HOUSEHOLDS
81.0/ 100
METRIC RATING
154th/ 347
METRIC RANK
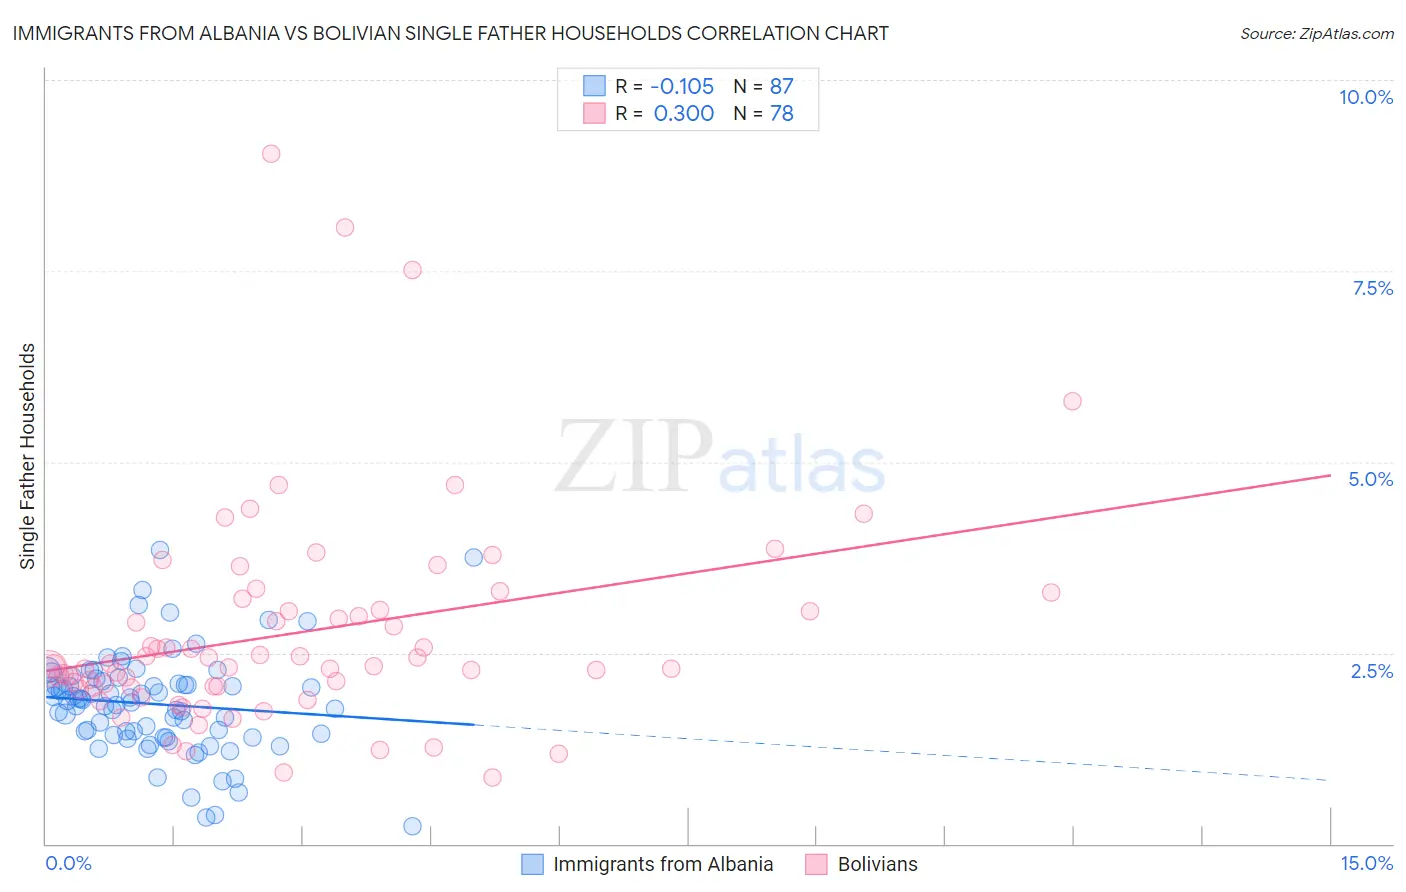
Immigrants from Albania vs Bolivian Single Father Households Correlation Chart
The statistical analysis conducted on geographies consisting of 118,928,765 people shows a poor negative correlation between the proportion of Immigrants from Albania and percentage of single father households in the United States with a correlation coefficient (R) of -0.105 and weighted average of 1.9%. Similarly, the statistical analysis conducted on geographies consisting of 184,110,694 people shows a mild positive correlation between the proportion of Bolivians and percentage of single father households in the United States with a correlation coefficient (R) of 0.300 and weighted average of 2.3%, a difference of 17.9%.
Single Father Households Correlation Summary
| Measurement | Immigrants from Albania | Bolivian |
| Minimum | 0.23% | 0.87% |
| Maximum | 3.8% | 9.0% |
| Range | 3.6% | 8.2% |
| Mean | 1.8% | 2.8% |
| Median | 1.9% | 2.3% |
| Interquartile 25% (IQ1) | 1.4% | 2.0% |
| Interquartile 75% (IQ3) | 2.1% | 3.1% |
| Interquartile Range (IQR) | 0.70% | 1.0% |
| Standard Deviation (Sample) | 0.66% | 1.4% |
| Standard Deviation (Population) | 0.66% | 1.4% |
Similar Demographics by Single Father Households
Demographics Similar to Immigrants from Albania by Single Father Households
In terms of single father households, the demographic groups most similar to Immigrants from Albania are Immigrants from Latvia (1.9%, a difference of 0.19%), Thai (1.9%, a difference of 0.30%), Iranian (1.9%, a difference of 0.37%), Indian (Asian) (1.9%, a difference of 1.2%), and Immigrants from Croatia (2.0%, a difference of 1.4%).
| Demographics | Rating | Rank | Single Father Households |
| Immigrants | Lithuania | 100.0 /100 | #14 | Exceptional 1.9% |
| Immigrants | Eastern Asia | 100.0 /100 | #15 | Exceptional 1.9% |
| Immigrants | Iran | 100.0 /100 | #16 | Exceptional 1.9% |
| Immigrants | India | 100.0 /100 | #17 | Exceptional 1.9% |
| Indians (Asian) | 100.0 /100 | #18 | Exceptional 1.9% |
| Iranians | 100.0 /100 | #19 | Exceptional 1.9% |
| Thais | 100.0 /100 | #20 | Exceptional 1.9% |
| Immigrants | Albania | 100.0 /100 | #21 | Exceptional 1.9% |
| Immigrants | Latvia | 100.0 /100 | #22 | Exceptional 1.9% |
| Immigrants | Croatia | 100.0 /100 | #23 | Exceptional 2.0% |
| Immigrants | Russia | 100.0 /100 | #24 | Exceptional 2.0% |
| Eastern Europeans | 100.0 /100 | #25 | Exceptional 2.0% |
| Assyrians/Chaldeans/Syriacs | 100.0 /100 | #26 | Exceptional 2.0% |
| Immigrants | South Central Asia | 100.0 /100 | #27 | Exceptional 2.0% |
| Immigrants | Japan | 100.0 /100 | #28 | Exceptional 2.0% |
Demographics Similar to Bolivians by Single Father Households
In terms of single father households, the demographic groups most similar to Bolivians are European (2.3%, a difference of 0.020%), Immigrants from South America (2.3%, a difference of 0.14%), Canadian (2.3%, a difference of 0.16%), Immigrants from Senegal (2.3%, a difference of 0.19%), and Immigrants from Germany (2.3%, a difference of 0.22%).
| Demographics | Rating | Rank | Single Father Households |
| Slavs | 88.9 /100 | #147 | Excellent 2.2% |
| South American Indians | 88.5 /100 | #148 | Excellent 2.3% |
| Senegalese | 88.4 /100 | #149 | Excellent 2.3% |
| Venezuelans | 86.2 /100 | #150 | Excellent 2.3% |
| Immigrants | Syria | 84.8 /100 | #151 | Excellent 2.3% |
| Immigrants | Venezuela | 83.2 /100 | #152 | Excellent 2.3% |
| Immigrants | Germany | 82.8 /100 | #153 | Excellent 2.3% |
| Bolivians | 81.0 /100 | #154 | Excellent 2.3% |
| Europeans | 80.9 /100 | #155 | Excellent 2.3% |
| Immigrants | South America | 79.9 /100 | #156 | Good 2.3% |
| Canadians | 79.7 /100 | #157 | Good 2.3% |
| Immigrants | Senegal | 79.4 /100 | #158 | Good 2.3% |
| Immigrants | West Indies | 77.9 /100 | #159 | Good 2.3% |
| Immigrants | Bolivia | 76.3 /100 | #160 | Good 2.3% |
| Swiss | 73.2 /100 | #161 | Good 2.3% |