Immigrants from Dominica vs Immigrants from Armenia Family Households
COMPARE
Immigrants from Dominica
Immigrants from Armenia
Family Households
Family Households Comparison
Immigrants from Dominica
Immigrants from Armenia
63.4%
FAMILY HOUSEHOLDS
1.6/ 100
METRIC RATING
245th/ 347
METRIC RANK
63.5%
FAMILY HOUSEHOLDS
2.6/ 100
METRIC RATING
233rd/ 347
METRIC RANK
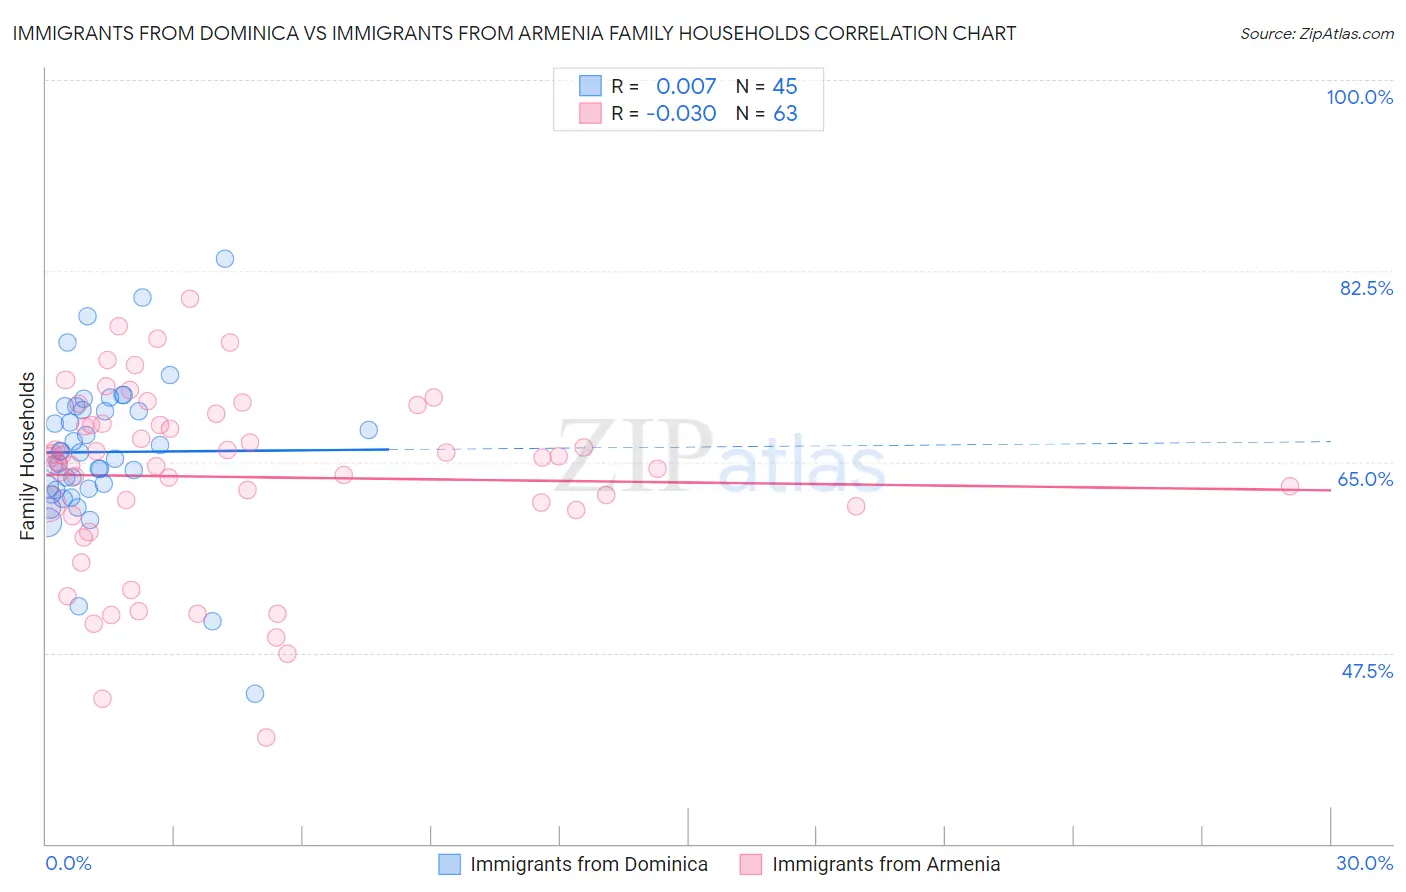
Immigrants from Dominica vs Immigrants from Armenia Family Households Correlation Chart
The statistical analysis conducted on geographies consisting of 83,778,248 people shows no correlation between the proportion of Immigrants from Dominica and percentage of family households in the United States with a correlation coefficient (R) of 0.007 and weighted average of 63.4%. Similarly, the statistical analysis conducted on geographies consisting of 97,683,198 people shows no correlation between the proportion of Immigrants from Armenia and percentage of family households in the United States with a correlation coefficient (R) of -0.030 and weighted average of 63.5%, a difference of 0.16%.
Family Households Correlation Summary
| Measurement | Immigrants from Dominica | Immigrants from Armenia |
| Minimum | 43.8% | 39.7% |
| Maximum | 83.7% | 79.9% |
| Range | 39.9% | 40.2% |
| Mean | 65.9% | 63.6% |
| Median | 65.8% | 65.3% |
| Interquartile 25% (IQ1) | 62.5% | 60.6% |
| Interquartile 75% (IQ3) | 69.9% | 68.5% |
| Interquartile Range (IQR) | 7.5% | 7.9% |
| Standard Deviation (Sample) | 7.1% | 8.3% |
| Standard Deviation (Population) | 7.0% | 8.3% |
Demographics Similar to Immigrants from Dominica and Immigrants from Armenia by Family Households
In terms of family households, the demographic groups most similar to Immigrants from Dominica are Eastern European (63.4%, a difference of 0.0%), Immigrants from Ghana (63.4%, a difference of 0.020%), Immigrants from Czechoslovakia (63.4%, a difference of 0.030%), Immigrants from Uzbekistan (63.4%, a difference of 0.030%), and Immigrants from Israel (63.4%, a difference of 0.040%). Similarly, the demographic groups most similar to Immigrants from Armenia are Immigrants from Northern Africa (63.5%, a difference of 0.010%), Finnish (63.5%, a difference of 0.030%), Immigrants from Greece (63.5%, a difference of 0.050%), Albanian (63.5%, a difference of 0.050%), and Immigrants from Brazil (63.6%, a difference of 0.060%).
| Demographics | Rating | Rank | Family Households |
| Bulgarians | 3.4 /100 | #229 | Tragic 63.6% |
| Immigrants | Brazil | 3.0 /100 | #230 | Tragic 63.6% |
| Immigrants | Greece | 2.9 /100 | #231 | Tragic 63.5% |
| Immigrants | Northern Africa | 2.6 /100 | #232 | Tragic 63.5% |
| Immigrants | Armenia | 2.6 /100 | #233 | Tragic 63.5% |
| Finns | 2.3 /100 | #234 | Tragic 63.5% |
| Albanians | 2.2 /100 | #235 | Tragic 63.5% |
| Ghanaians | 2.1 /100 | #236 | Tragic 63.5% |
| Comanche | 2.1 /100 | #237 | Tragic 63.5% |
| Immigrants | Zimbabwe | 2.0 /100 | #238 | Tragic 63.5% |
| Aleuts | 1.9 /100 | #239 | Tragic 63.4% |
| South Africans | 1.9 /100 | #240 | Tragic 63.4% |
| Immigrants | St. Vincent and the Grenadines | 1.9 /100 | #241 | Tragic 63.4% |
| Immigrants | Israel | 1.8 /100 | #242 | Tragic 63.4% |
| Immigrants | Czechoslovakia | 1.8 /100 | #243 | Tragic 63.4% |
| Eastern Europeans | 1.6 /100 | #244 | Tragic 63.4% |
| Immigrants | Dominica | 1.6 /100 | #245 | Tragic 63.4% |
| Immigrants | Ghana | 1.6 /100 | #246 | Tragic 63.4% |
| Immigrants | Uzbekistan | 1.5 /100 | #247 | Tragic 63.4% |
| Dominicans | 1.5 /100 | #248 | Tragic 63.4% |
| Russians | 1.4 /100 | #249 | Tragic 63.4% |