Hmong vs Menominee Divorced or Separated
COMPARE
Hmong
Menominee
Divorced or Separated
Divorced or Separated Comparison
Hmong
Menominee
12.3%
DIVORCED OR SEPARATED
8.8/ 100
METRIC RATING
227th/ 347
METRIC RANK
11.8%
DIVORCED OR SEPARATED
93.8/ 100
METRIC RATING
122nd/ 347
METRIC RANK
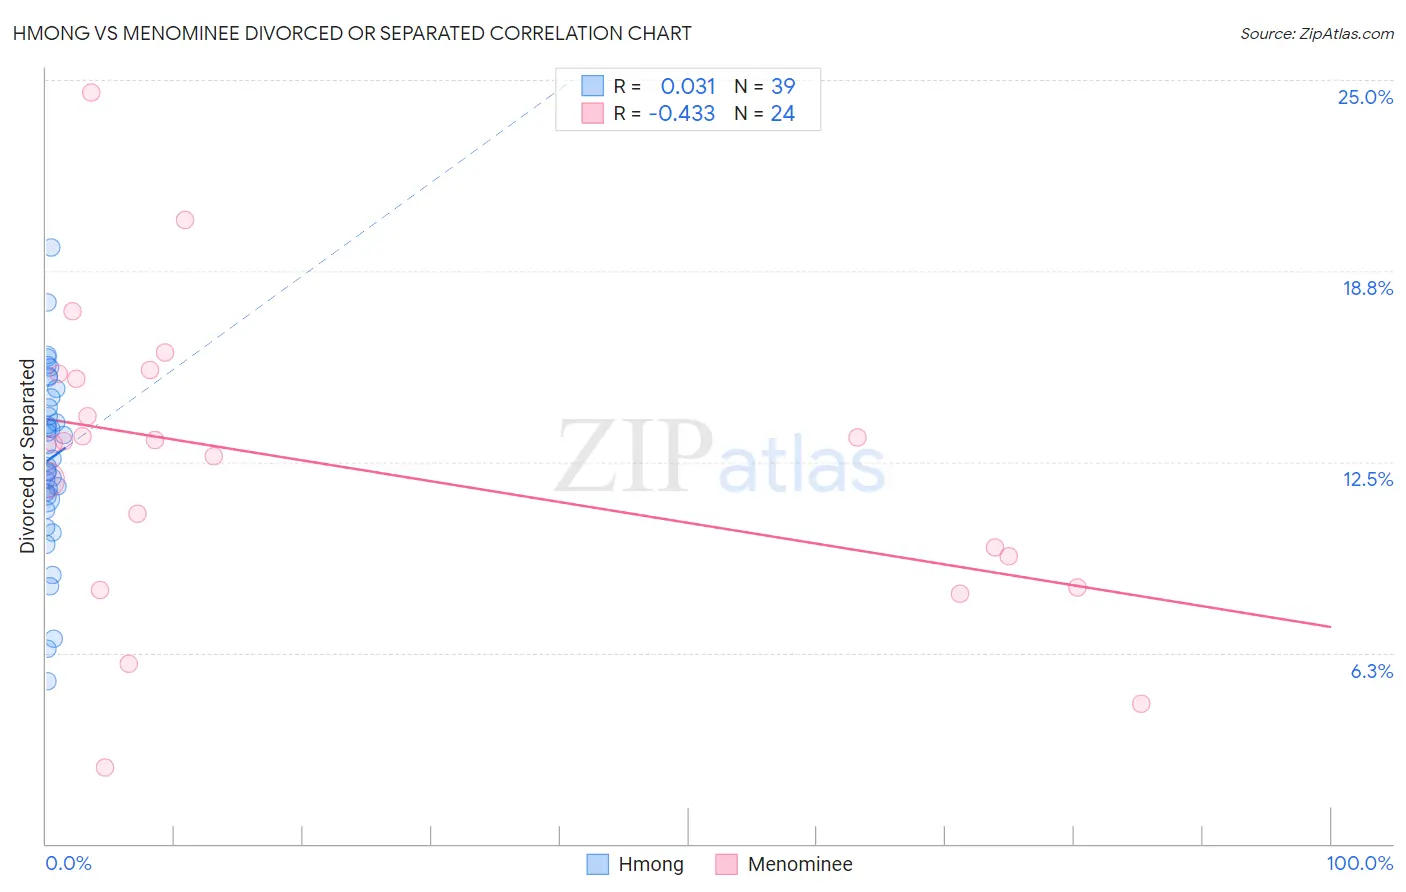
Hmong vs Menominee Divorced or Separated Correlation Chart
The statistical analysis conducted on geographies consisting of 24,678,157 people shows no correlation between the proportion of Hmong and percentage of population currently divorced or separated in the United States with a correlation coefficient (R) of 0.031 and weighted average of 12.3%. Similarly, the statistical analysis conducted on geographies consisting of 45,778,710 people shows a moderate negative correlation between the proportion of Menominee and percentage of population currently divorced or separated in the United States with a correlation coefficient (R) of -0.433 and weighted average of 11.8%, a difference of 4.5%.
Divorced or Separated Correlation Summary
| Measurement | Hmong | Menominee |
| Minimum | 5.3% | 2.5% |
| Maximum | 19.5% | 24.6% |
| Range | 14.2% | 22.1% |
| Mean | 12.6% | 12.4% |
| Median | 12.6% | 13.1% |
| Interquartile 25% (IQ1) | 11.3% | 8.9% |
| Interquartile 75% (IQ3) | 14.6% | 15.3% |
| Interquartile Range (IQR) | 3.3% | 6.4% |
| Standard Deviation (Sample) | 3.0% | 4.9% |
| Standard Deviation (Population) | 2.9% | 4.8% |
Similar Demographics by Divorced or Separated
Demographics Similar to Hmong by Divorced or Separated
In terms of divorced or separated, the demographic groups most similar to Hmong are Immigrants from Western Africa (12.3%, a difference of 0.050%), Immigrants from Cameroon (12.3%, a difference of 0.050%), Immigrants from Sudan (12.3%, a difference of 0.070%), Immigrants from the Azores (12.3%, a difference of 0.090%), and Belgian (12.3%, a difference of 0.090%).
| Demographics | Rating | Rank | Divorced or Separated |
| British | 11.6 /100 | #220 | Poor 12.3% |
| Guamanians/Chamorros | 11.3 /100 | #221 | Poor 12.3% |
| Bangladeshis | 10.5 /100 | #222 | Poor 12.3% |
| Scandinavians | 10.4 /100 | #223 | Poor 12.3% |
| Immigrants | Azores | 9.7 /100 | #224 | Tragic 12.3% |
| Belgians | 9.7 /100 | #225 | Tragic 12.3% |
| Immigrants | Western Africa | 9.3 /100 | #226 | Tragic 12.3% |
| Hmong | 8.8 /100 | #227 | Tragic 12.3% |
| Immigrants | Cameroon | 8.3 /100 | #228 | Tragic 12.3% |
| Immigrants | Sudan | 8.2 /100 | #229 | Tragic 12.3% |
| Yakama | 7.8 /100 | #230 | Tragic 12.3% |
| Yugoslavians | 6.6 /100 | #231 | Tragic 12.3% |
| Canadians | 5.3 /100 | #232 | Tragic 12.4% |
| Malaysians | 4.8 /100 | #233 | Tragic 12.4% |
| West Indians | 4.4 /100 | #234 | Tragic 12.4% |
Demographics Similar to Menominee by Divorced or Separated
In terms of divorced or separated, the demographic groups most similar to Menominee are Immigrants (11.8%, a difference of 0.020%), Ugandan (11.8%, a difference of 0.090%), Romanian (11.8%, a difference of 0.12%), Iraqi (11.8%, a difference of 0.13%), and Ukrainian (11.8%, a difference of 0.20%).
| Demographics | Rating | Rank | Divorced or Separated |
| Lithuanians | 95.7 /100 | #115 | Exceptional 11.7% |
| Immigrants | Iraq | 95.4 /100 | #116 | Exceptional 11.7% |
| Immigrants | Uganda | 95.3 /100 | #117 | Exceptional 11.7% |
| Ecuadorians | 95.3 /100 | #118 | Exceptional 11.7% |
| Syrians | 95.1 /100 | #119 | Exceptional 11.7% |
| Iraqis | 94.6 /100 | #120 | Exceptional 11.8% |
| Romanians | 94.5 /100 | #121 | Exceptional 11.8% |
| Menominee | 93.8 /100 | #122 | Exceptional 11.8% |
| Immigrants | Immigrants | 93.7 /100 | #123 | Exceptional 11.8% |
| Ugandans | 93.1 /100 | #124 | Exceptional 11.8% |
| Ukrainians | 92.3 /100 | #125 | Exceptional 11.8% |
| South American Indians | 92.1 /100 | #126 | Exceptional 11.8% |
| South Africans | 88.9 /100 | #127 | Excellent 11.8% |
| Immigrants | Ecuador | 88.9 /100 | #128 | Excellent 11.8% |
| Immigrants | St. Vincent and the Grenadines | 88.4 /100 | #129 | Excellent 11.8% |