Ghanaian vs Immigrants from Vietnam Single Mother Households
COMPARE
Ghanaian
Immigrants from Vietnam
Single Mother Households
Single Mother Households Comparison
Ghanaians
Immigrants from Vietnam
7.8%
SINGLE MOTHER HOUSEHOLDS
0.0/ 100
METRIC RATING
292nd/ 347
METRIC RANK
6.3%
SINGLE MOTHER HOUSEHOLDS
51.5/ 100
METRIC RATING
173rd/ 347
METRIC RANK
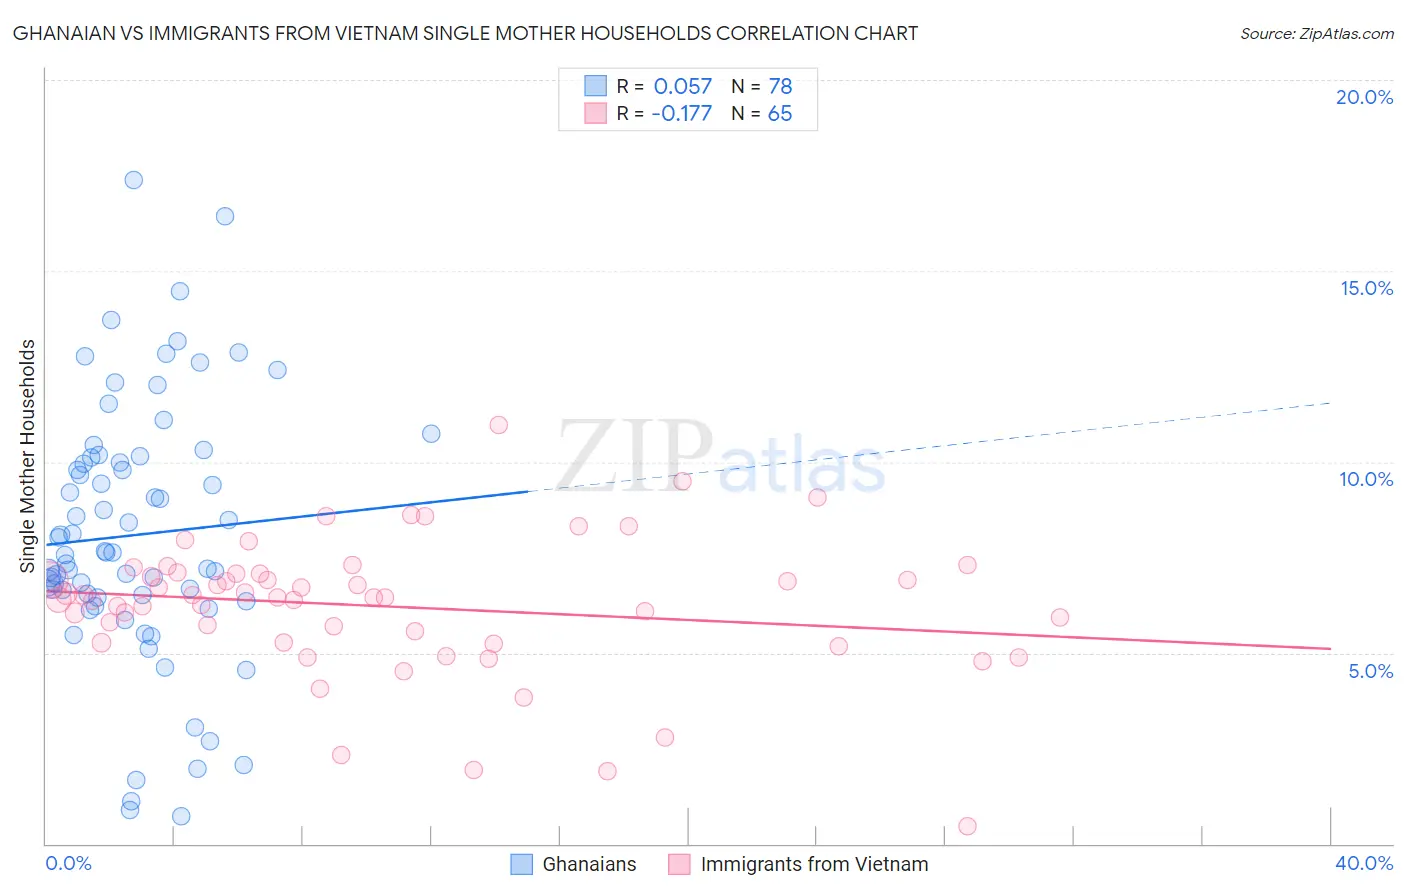
Ghanaian vs Immigrants from Vietnam Single Mother Households Correlation Chart
The statistical analysis conducted on geographies consisting of 190,389,453 people shows a slight positive correlation between the proportion of Ghanaians and percentage of single mother households in the United States with a correlation coefficient (R) of 0.057 and weighted average of 7.8%. Similarly, the statistical analysis conducted on geographies consisting of 403,855,615 people shows a poor negative correlation between the proportion of Immigrants from Vietnam and percentage of single mother households in the United States with a correlation coefficient (R) of -0.177 and weighted average of 6.3%, a difference of 24.5%.
Single Mother Households Correlation Summary
| Measurement | Ghanaian | Immigrants from Vietnam |
| Minimum | 0.73% | 0.45% |
| Maximum | 17.4% | 11.0% |
| Range | 16.6% | 10.5% |
| Mean | 8.1% | 6.2% |
| Median | 7.6% | 6.4% |
| Interquartile 25% (IQ1) | 6.4% | 5.3% |
| Interquartile 75% (IQ3) | 10.1% | 7.1% |
| Interquartile Range (IQR) | 3.7% | 1.8% |
| Standard Deviation (Sample) | 3.4% | 1.8% |
| Standard Deviation (Population) | 3.4% | 1.8% |
Similar Demographics by Single Mother Households
Demographics Similar to Ghanaians by Single Mother Households
In terms of single mother households, the demographic groups most similar to Ghanaians are West Indian (7.8%, a difference of 0.010%), Immigrants from Nigeria (7.8%, a difference of 0.090%), Immigrants from Cameroon (7.9%, a difference of 0.36%), Apache (7.9%, a difference of 0.46%), and Subsaharan African (7.8%, a difference of 0.51%).
| Demographics | Rating | Rank | Single Mother Households |
| Trinidadians and Tobagonians | 0.0 /100 | #285 | Tragic 7.7% |
| Immigrants | Middle Africa | 0.0 /100 | #286 | Tragic 7.7% |
| Immigrants | Guatemala | 0.0 /100 | #287 | Tragic 7.7% |
| Sierra Leoneans | 0.0 /100 | #288 | Tragic 7.7% |
| Sub-Saharan Africans | 0.0 /100 | #289 | Tragic 7.8% |
| Immigrants | Nigeria | 0.0 /100 | #290 | Tragic 7.8% |
| West Indians | 0.0 /100 | #291 | Tragic 7.8% |
| Ghanaians | 0.0 /100 | #292 | Tragic 7.8% |
| Immigrants | Cameroon | 0.0 /100 | #293 | Tragic 7.9% |
| Apache | 0.0 /100 | #294 | Tragic 7.9% |
| Barbadians | 0.0 /100 | #295 | Tragic 7.9% |
| Immigrants | Latin America | 0.0 /100 | #296 | Tragic 7.9% |
| Hispanics or Latinos | 0.0 /100 | #297 | Tragic 7.9% |
| Immigrants | West Indies | 0.0 /100 | #298 | Tragic 7.9% |
| Houma | 0.0 /100 | #299 | Tragic 7.9% |
Demographics Similar to Immigrants from Vietnam by Single Mother Households
In terms of single mother households, the demographic groups most similar to Immigrants from Vietnam are Immigrants from South Eastern Asia (6.3%, a difference of 0.070%), Afghan (6.3%, a difference of 0.11%), Immigrants from Morocco (6.3%, a difference of 0.17%), Immigrants from Oceania (6.3%, a difference of 0.34%), and Marshallese (6.3%, a difference of 0.63%).
| Demographics | Rating | Rank | Single Mother Households |
| Sri Lankans | 63.9 /100 | #166 | Good 6.2% |
| Brazilians | 59.1 /100 | #167 | Average 6.2% |
| Immigrants | Chile | 58.3 /100 | #168 | Average 6.3% |
| Puget Sound Salish | 58.1 /100 | #169 | Average 6.3% |
| Immigrants | Oceania | 54.6 /100 | #170 | Average 6.3% |
| Afghans | 52.5 /100 | #171 | Average 6.3% |
| Immigrants | South Eastern Asia | 52.2 /100 | #172 | Average 6.3% |
| Immigrants | Vietnam | 51.5 /100 | #173 | Average 6.3% |
| Immigrants | Morocco | 50.0 /100 | #174 | Average 6.3% |
| Marshallese | 45.8 /100 | #175 | Average 6.3% |
| Immigrants | Bosnia and Herzegovina | 44.3 /100 | #176 | Average 6.3% |
| Osage | 43.0 /100 | #177 | Average 6.4% |
| Portuguese | 40.0 /100 | #178 | Fair 6.4% |
| Hmong | 39.8 /100 | #179 | Fair 6.4% |
| Immigrants | Nepal | 36.1 /100 | #180 | Fair 6.4% |