Taiwanese vs Immigrants from Barbados Single Father Households
COMPARE
Taiwanese
Immigrants from Barbados
Single Father Households
Single Father Households Comparison
Taiwanese
Immigrants from Barbados
2.2%
SINGLE FATHER HOUSEHOLDS
96.3/ 100
METRIC RATING
133rd/ 347
METRIC RANK
2.2%
SINGLE FATHER HOUSEHOLDS
98.2/ 100
METRIC RATING
115th/ 347
METRIC RANK
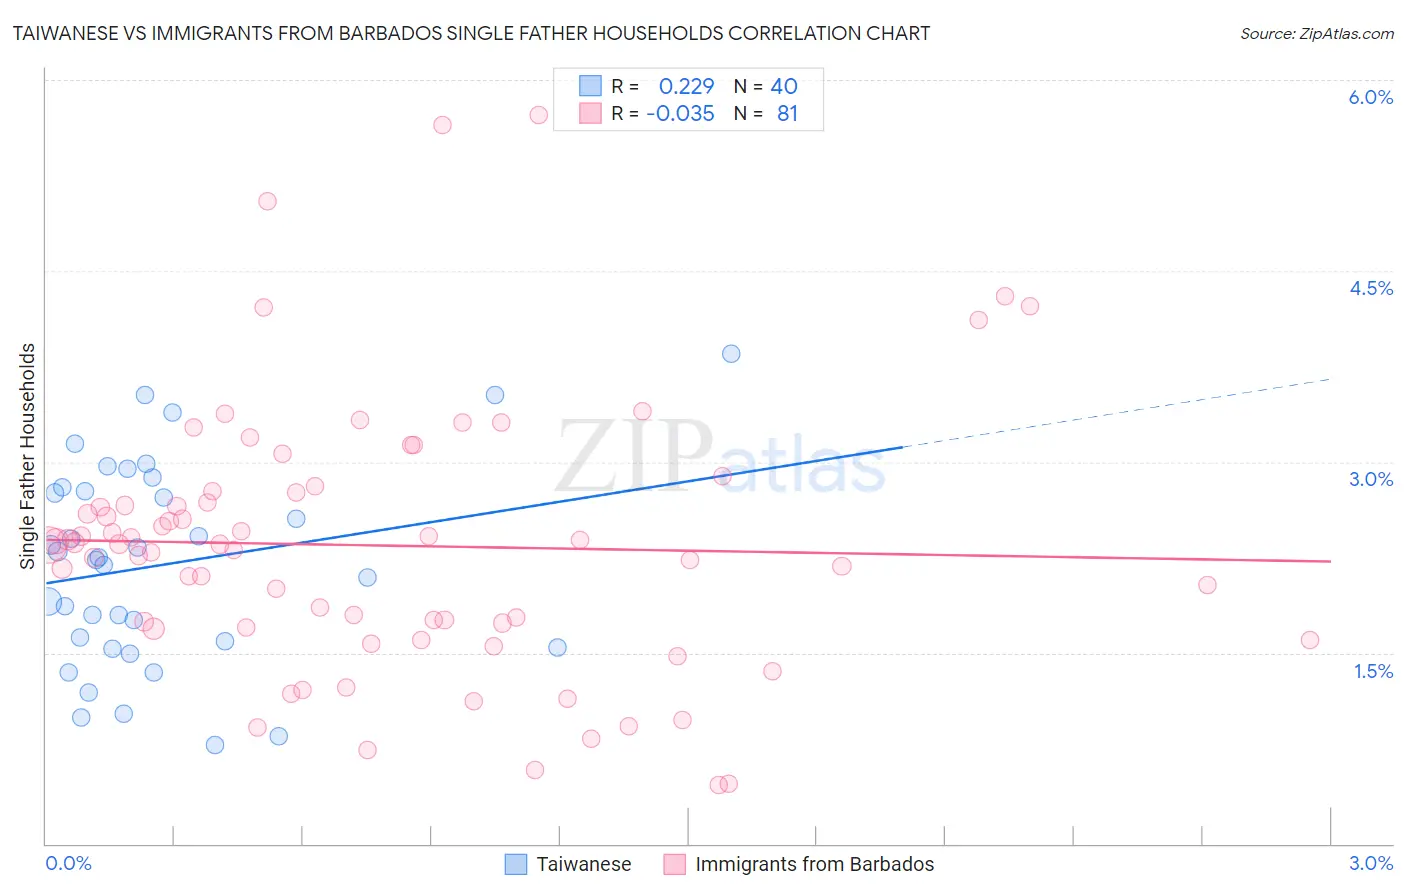
Taiwanese vs Immigrants from Barbados Single Father Households Correlation Chart
The statistical analysis conducted on geographies consisting of 31,679,530 people shows a weak positive correlation between the proportion of Taiwanese and percentage of single father households in the United States with a correlation coefficient (R) of 0.229 and weighted average of 2.2%. Similarly, the statistical analysis conducted on geographies consisting of 112,598,032 people shows no correlation between the proportion of Immigrants from Barbados and percentage of single father households in the United States with a correlation coefficient (R) of -0.035 and weighted average of 2.2%, a difference of 1.4%.
Single Father Households Correlation Summary
| Measurement | Taiwanese | Immigrants from Barbados |
| Minimum | 0.77% | 0.46% |
| Maximum | 3.9% | 5.7% |
| Range | 3.1% | 5.3% |
| Mean | 2.2% | 2.3% |
| Median | 2.2% | 2.4% |
| Interquartile 25% (IQ1) | 1.6% | 1.7% |
| Interquartile 75% (IQ3) | 2.8% | 2.8% |
| Interquartile Range (IQR) | 1.2% | 1.1% |
| Standard Deviation (Sample) | 0.79% | 1.1% |
| Standard Deviation (Population) | 0.78% | 1.0% |
Demographics Similar to Taiwanese and Immigrants from Barbados by Single Father Households
In terms of single father households, the demographic groups most similar to Taiwanese are Polish (2.2%, a difference of 0.12%), Immigrants from Jordan (2.2%, a difference of 0.13%), Immigrants from Chile (2.2%, a difference of 0.19%), Serbian (2.2%, a difference of 0.30%), and Immigrants from England (2.2%, a difference of 0.31%). Similarly, the demographic groups most similar to Immigrants from Barbados are Immigrants from North America (2.2%, a difference of 0.030%), Immigrants from Argentina (2.2%, a difference of 0.030%), Hungarian (2.2%, a difference of 0.22%), Immigrants from Morocco (2.2%, a difference of 0.32%), and Trinidadian and Tobagonian (2.2%, a difference of 0.37%).
| Demographics | Rating | Rank | Single Father Households |
| Immigrants | North America | 98.2 /100 | #114 | Exceptional 2.2% |
| Immigrants | Barbados | 98.2 /100 | #115 | Exceptional 2.2% |
| Immigrants | Argentina | 98.1 /100 | #116 | Exceptional 2.2% |
| Hungarians | 97.9 /100 | #117 | Exceptional 2.2% |
| Immigrants | Morocco | 97.8 /100 | #118 | Exceptional 2.2% |
| Trinidadians and Tobagonians | 97.8 /100 | #119 | Exceptional 2.2% |
| Australians | 97.7 /100 | #120 | Exceptional 2.2% |
| Immigrants | Brazil | 97.7 /100 | #121 | Exceptional 2.2% |
| Immigrants | Iraq | 97.6 /100 | #122 | Exceptional 2.2% |
| Immigrants | Yemen | 97.5 /100 | #123 | Exceptional 2.2% |
| British West Indians | 97.4 /100 | #124 | Exceptional 2.2% |
| Immigrants | Indonesia | 97.4 /100 | #125 | Exceptional 2.2% |
| Moroccans | 96.9 /100 | #126 | Exceptional 2.2% |
| Jordanians | 96.9 /100 | #127 | Exceptional 2.2% |
| Immigrants | England | 96.8 /100 | #128 | Exceptional 2.2% |
| Serbians | 96.8 /100 | #129 | Exceptional 2.2% |
| Immigrants | Chile | 96.7 /100 | #130 | Exceptional 2.2% |
| Immigrants | Jordan | 96.6 /100 | #131 | Exceptional 2.2% |
| Poles | 96.5 /100 | #132 | Exceptional 2.2% |
| Taiwanese | 96.3 /100 | #133 | Exceptional 2.2% |
| Zimbabweans | 95.1 /100 | #134 | Exceptional 2.2% |