Immigrants from Hungary vs Egyptian Divorced or Separated
COMPARE
Immigrants from Hungary
Egyptian
Divorced or Separated
Divorced or Separated Comparison
Immigrants from Hungary
Egyptians
11.9%
DIVORCED OR SEPARATED
73.7/ 100
METRIC RATING
152nd/ 347
METRIC RANK
11.1%
DIVORCED OR SEPARATED
100.0/ 100
METRIC RATING
33rd/ 347
METRIC RANK
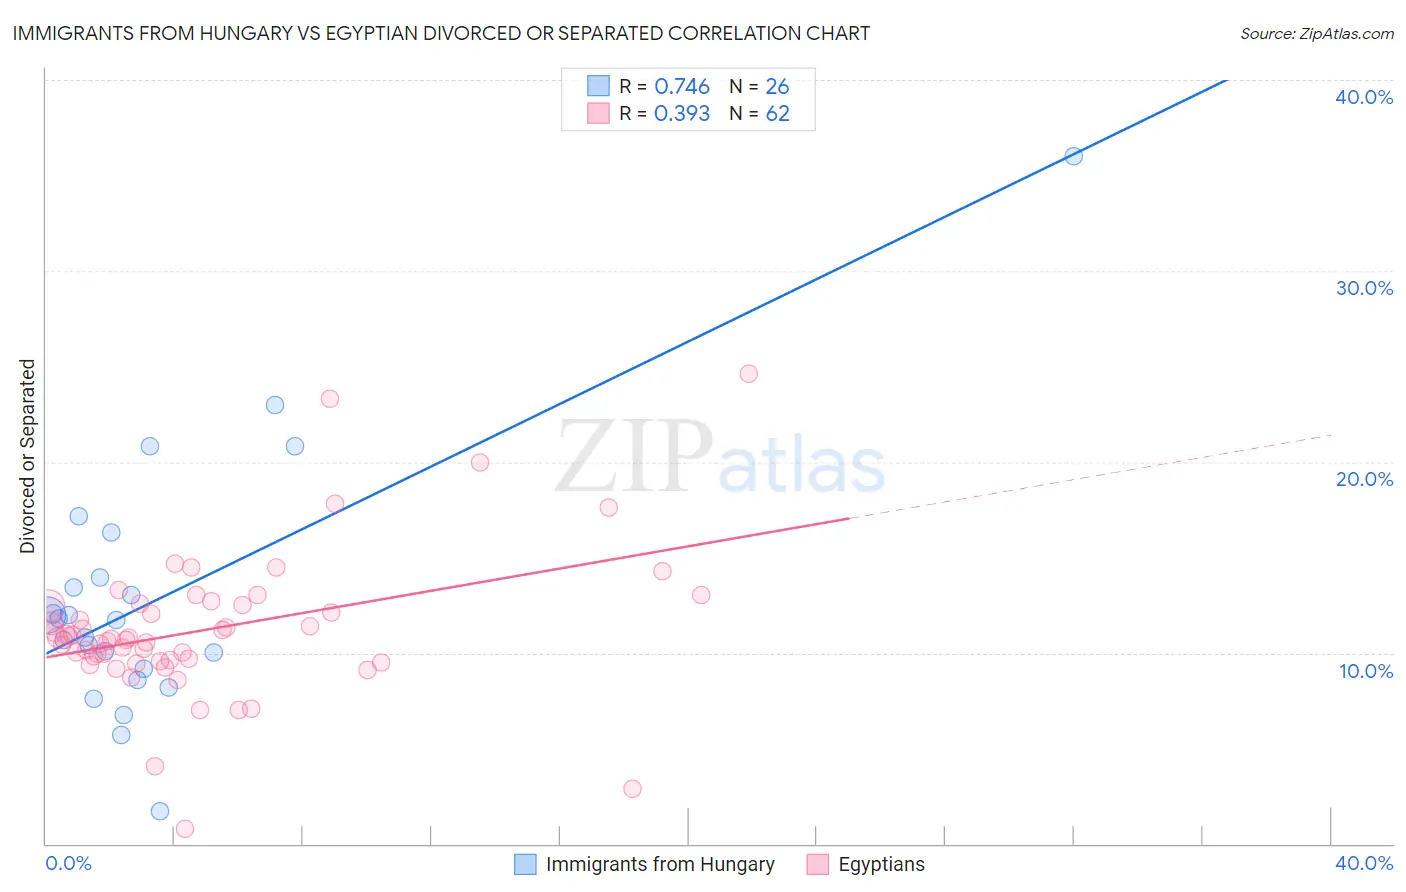
Immigrants from Hungary vs Egyptian Divorced or Separated Correlation Chart
The statistical analysis conducted on geographies consisting of 195,671,532 people shows a strong positive correlation between the proportion of Immigrants from Hungary and percentage of population currently divorced or separated in the United States with a correlation coefficient (R) of 0.746 and weighted average of 11.9%. Similarly, the statistical analysis conducted on geographies consisting of 276,808,669 people shows a mild positive correlation between the proportion of Egyptians and percentage of population currently divorced or separated in the United States with a correlation coefficient (R) of 0.393 and weighted average of 11.1%, a difference of 7.9%.
Divorced or Separated Correlation Summary
| Measurement | Immigrants from Hungary | Egyptian |
| Minimum | 1.7% | 0.80% |
| Maximum | 36.0% | 24.6% |
| Range | 34.3% | 23.8% |
| Mean | 12.8% | 11.2% |
| Median | 11.8% | 10.8% |
| Interquartile 25% (IQ1) | 9.2% | 9.6% |
| Interquartile 75% (IQ3) | 13.9% | 12.5% |
| Interquartile Range (IQR) | 4.7% | 2.9% |
| Standard Deviation (Sample) | 6.7% | 3.8% |
| Standard Deviation (Population) | 6.6% | 3.8% |
Similar Demographics by Divorced or Separated
Demographics Similar to Immigrants from Hungary by Divorced or Separated
In terms of divorced or separated, the demographic groups most similar to Immigrants from Hungary are Austrian (12.0%, a difference of 0.070%), Chilean (12.0%, a difference of 0.10%), Japanese (12.0%, a difference of 0.12%), Czech (11.9%, a difference of 0.13%), and Hungarian (12.0%, a difference of 0.15%).
| Demographics | Rating | Rank | Divorced or Separated |
| Croatians | 80.6 /100 | #145 | Excellent 11.9% |
| Immigrants | Grenada | 79.1 /100 | #146 | Good 11.9% |
| Poles | 78.6 /100 | #147 | Good 11.9% |
| Italians | 77.8 /100 | #148 | Good 11.9% |
| Immigrants | Oceania | 77.7 /100 | #149 | Good 11.9% |
| Immigrants | Portugal | 77.3 /100 | #150 | Good 11.9% |
| Czechs | 76.4 /100 | #151 | Good 11.9% |
| Immigrants | Hungary | 73.7 /100 | #152 | Good 11.9% |
| Austrians | 72.2 /100 | #153 | Good 12.0% |
| Chileans | 71.3 /100 | #154 | Good 12.0% |
| Japanese | 70.9 /100 | #155 | Good 12.0% |
| Hungarians | 70.3 /100 | #156 | Good 12.0% |
| Immigrants | Brazil | 68.8 /100 | #157 | Good 12.0% |
| Icelanders | 66.0 /100 | #158 | Good 12.0% |
| Immigrants | Barbados | 66.0 /100 | #159 | Good 12.0% |
Demographics Similar to Egyptians by Divorced or Separated
In terms of divorced or separated, the demographic groups most similar to Egyptians are Tongan (11.1%, a difference of 0.040%), Immigrants from Uzbekistan (11.1%, a difference of 0.070%), Mongolian (11.1%, a difference of 0.12%), Cambodian (11.1%, a difference of 0.15%), and Immigrants from Japan (11.1%, a difference of 0.21%).
| Demographics | Rating | Rank | Divorced or Separated |
| Immigrants | Indonesia | 100.0 /100 | #26 | Exceptional 10.9% |
| Immigrants | Bangladesh | 100.0 /100 | #27 | Exceptional 11.0% |
| Immigrants | Malaysia | 100.0 /100 | #28 | Exceptional 11.0% |
| Armenians | 100.0 /100 | #29 | Exceptional 11.0% |
| Immigrants | Ireland | 100.0 /100 | #30 | Exceptional 11.0% |
| Mongolians | 100.0 /100 | #31 | Exceptional 11.1% |
| Tongans | 100.0 /100 | #32 | Exceptional 11.1% |
| Egyptians | 100.0 /100 | #33 | Exceptional 11.1% |
| Immigrants | Uzbekistan | 100.0 /100 | #34 | Exceptional 11.1% |
| Cambodians | 100.0 /100 | #35 | Exceptional 11.1% |
| Immigrants | Japan | 100.0 /100 | #36 | Exceptional 11.1% |
| Immigrants | Lebanon | 100.0 /100 | #37 | Exceptional 11.1% |
| Immigrants | Greece | 100.0 /100 | #38 | Exceptional 11.1% |
| Immigrants | Egypt | 100.0 /100 | #39 | Exceptional 11.1% |
| Soviet Union | 100.0 /100 | #40 | Exceptional 11.1% |