Immigrants from Belarus vs Eastern European Divorced or Separated
COMPARE
Immigrants from Belarus
Eastern European
Divorced or Separated
Divorced or Separated Comparison
Immigrants from Belarus
Eastern Europeans
11.2%
DIVORCED OR SEPARATED
100.0/ 100
METRIC RATING
43rd/ 347
METRIC RANK
11.3%
DIVORCED OR SEPARATED
99.9/ 100
METRIC RATING
54th/ 347
METRIC RANK
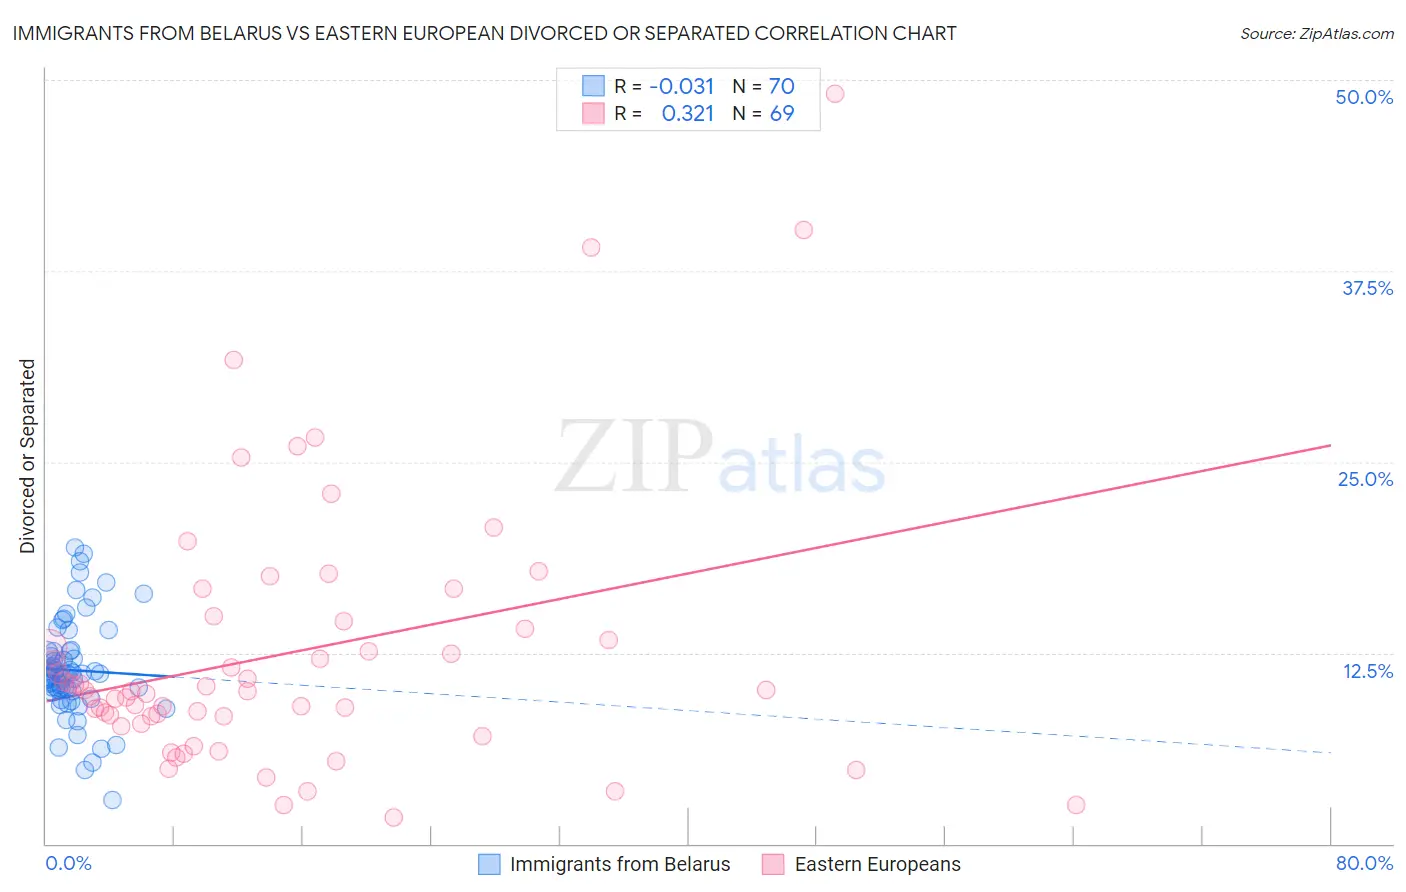
Immigrants from Belarus vs Eastern European Divorced or Separated Correlation Chart
The statistical analysis conducted on geographies consisting of 150,192,377 people shows no correlation between the proportion of Immigrants from Belarus and percentage of population currently divorced or separated in the United States with a correlation coefficient (R) of -0.031 and weighted average of 11.2%. Similarly, the statistical analysis conducted on geographies consisting of 461,055,019 people shows a mild positive correlation between the proportion of Eastern Europeans and percentage of population currently divorced or separated in the United States with a correlation coefficient (R) of 0.321 and weighted average of 11.3%, a difference of 1.0%.
Divorced or Separated Correlation Summary
| Measurement | Immigrants from Belarus | Eastern European |
| Minimum | 2.9% | 1.7% |
| Maximum | 19.4% | 49.1% |
| Range | 16.5% | 47.4% |
| Mean | 11.4% | 12.5% |
| Median | 11.1% | 10.0% |
| Interquartile 25% (IQ1) | 10.0% | 8.1% |
| Interquartile 75% (IQ3) | 12.6% | 14.3% |
| Interquartile Range (IQR) | 2.6% | 6.3% |
| Standard Deviation (Sample) | 3.2% | 8.9% |
| Standard Deviation (Population) | 3.2% | 8.8% |
Demographics Similar to Immigrants from Belarus and Eastern Europeans by Divorced or Separated
In terms of divorced or separated, the demographic groups most similar to Immigrants from Belarus are Chinese (11.2%, a difference of 0.010%), Immigrants from Western Asia (11.2%, a difference of 0.010%), Turkish (11.2%, a difference of 0.060%), Bhutanese (11.2%, a difference of 0.070%), and Laotian (11.2%, a difference of 0.17%). Similarly, the demographic groups most similar to Eastern Europeans are Immigrants from Yemen (11.3%, a difference of 0.010%), Immigrants from Philippines (11.3%, a difference of 0.070%), Immigrants from Vietnam (11.3%, a difference of 0.080%), Immigrants from Lithuania (11.3%, a difference of 0.11%), and Sri Lankan (11.3%, a difference of 0.14%).
| Demographics | Rating | Rank | Divorced or Separated |
| Immigrants | Greece | 100.0 /100 | #38 | Exceptional 11.1% |
| Immigrants | Egypt | 100.0 /100 | #39 | Exceptional 11.1% |
| Soviet Union | 100.0 /100 | #40 | Exceptional 11.1% |
| Bhutanese | 100.0 /100 | #41 | Exceptional 11.2% |
| Chinese | 100.0 /100 | #42 | Exceptional 11.2% |
| Immigrants | Belarus | 100.0 /100 | #43 | Exceptional 11.2% |
| Immigrants | Western Asia | 100.0 /100 | #44 | Exceptional 11.2% |
| Turks | 100.0 /100 | #45 | Exceptional 11.2% |
| Laotians | 100.0 /100 | #46 | Exceptional 11.2% |
| Immigrants | Poland | 100.0 /100 | #47 | Exceptional 11.2% |
| Immigrants | Turkey | 100.0 /100 | #48 | Exceptional 11.2% |
| Immigrants | Saudi Arabia | 100.0 /100 | #49 | Exceptional 11.2% |
| Bolivians | 100.0 /100 | #50 | Exceptional 11.2% |
| Immigrants | Bolivia | 100.0 /100 | #51 | Exceptional 11.3% |
| Immigrants | Australia | 99.9 /100 | #52 | Exceptional 11.3% |
| Immigrants | Lithuania | 99.9 /100 | #53 | Exceptional 11.3% |
| Eastern Europeans | 99.9 /100 | #54 | Exceptional 11.3% |
| Immigrants | Yemen | 99.9 /100 | #55 | Exceptional 11.3% |
| Immigrants | Philippines | 99.9 /100 | #56 | Exceptional 11.3% |
| Immigrants | Vietnam | 99.9 /100 | #57 | Exceptional 11.3% |
| Sri Lankans | 99.9 /100 | #58 | Exceptional 11.3% |