Pima vs Eastern European Divorced or Separated
COMPARE
Pima
Eastern European
Divorced or Separated
Divorced or Separated Comparison
Pima
Eastern Europeans
12.9%
DIVORCED OR SEPARATED
0.0/ 100
METRIC RATING
290th/ 347
METRIC RANK
11.3%
DIVORCED OR SEPARATED
99.9/ 100
METRIC RATING
54th/ 347
METRIC RANK
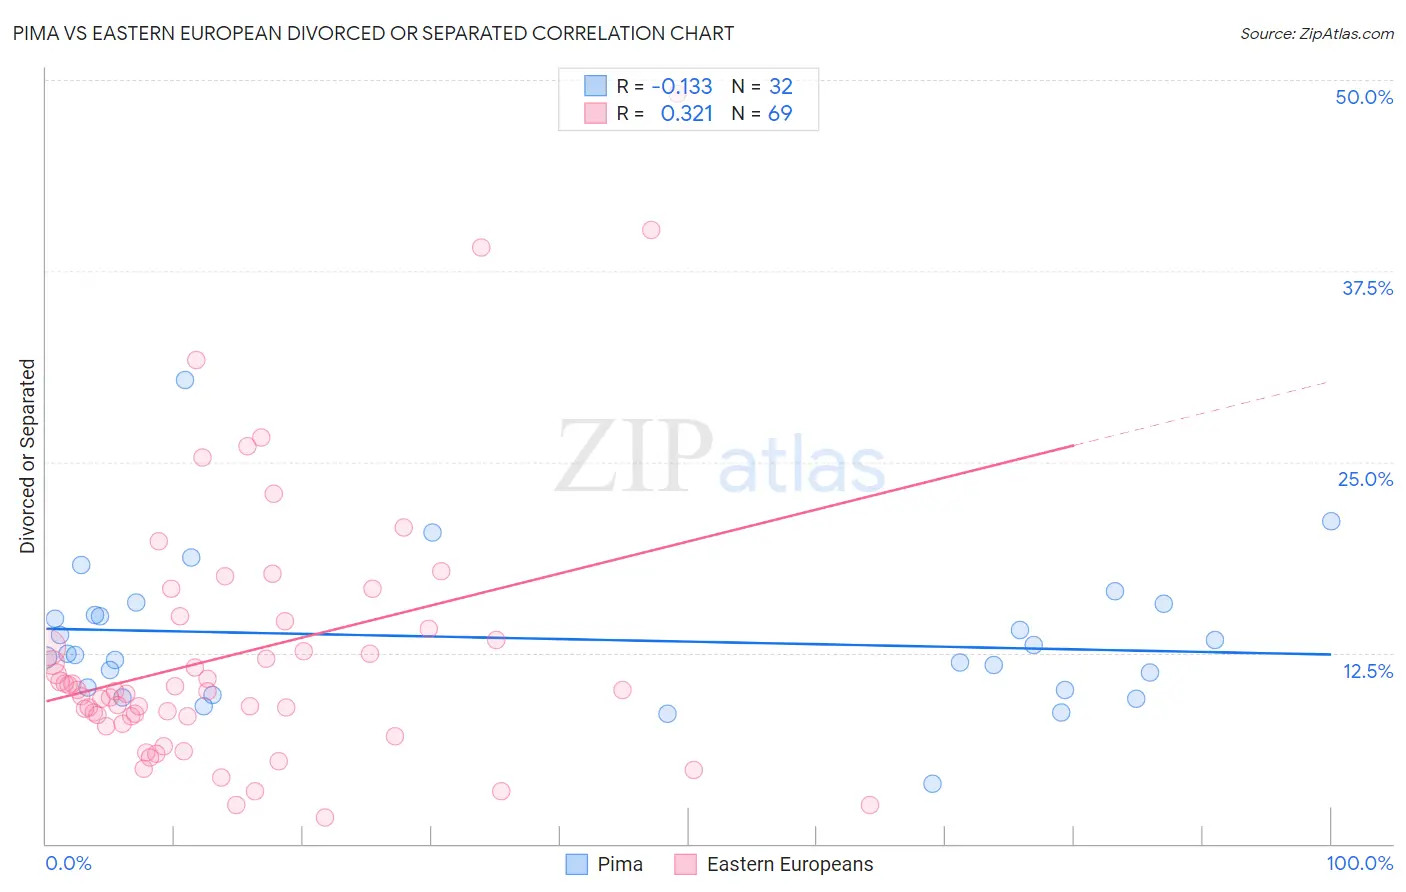
Pima vs Eastern European Divorced or Separated Correlation Chart
The statistical analysis conducted on geographies consisting of 61,551,758 people shows a poor negative correlation between the proportion of Pima and percentage of population currently divorced or separated in the United States with a correlation coefficient (R) of -0.133 and weighted average of 12.9%. Similarly, the statistical analysis conducted on geographies consisting of 461,055,019 people shows a mild positive correlation between the proportion of Eastern Europeans and percentage of population currently divorced or separated in the United States with a correlation coefficient (R) of 0.321 and weighted average of 11.3%, a difference of 14.0%.
Divorced or Separated Correlation Summary
| Measurement | Pima | Eastern European |
| Minimum | 3.9% | 1.7% |
| Maximum | 30.4% | 49.1% |
| Range | 26.5% | 47.4% |
| Mean | 13.4% | 12.5% |
| Median | 12.4% | 10.0% |
| Interquartile 25% (IQ1) | 10.2% | 8.1% |
| Interquartile 75% (IQ3) | 15.4% | 14.3% |
| Interquartile Range (IQR) | 5.2% | 6.3% |
| Standard Deviation (Sample) | 4.8% | 8.9% |
| Standard Deviation (Population) | 4.7% | 8.8% |
Similar Demographics by Divorced or Separated
Demographics Similar to Pima by Divorced or Separated
In terms of divorced or separated, the demographic groups most similar to Pima are Immigrants from Honduras (12.9%, a difference of 0.12%), Iroquois (12.9%, a difference of 0.14%), Scotch-Irish (12.9%, a difference of 0.17%), French Canadian (12.8%, a difference of 0.29%), and Jamaican (12.9%, a difference of 0.38%).
| Demographics | Rating | Rank | Divorced or Separated |
| Delaware | 0.1 /100 | #283 | Tragic 12.7% |
| Immigrants | Nonimmigrants | 0.1 /100 | #284 | Tragic 12.8% |
| French | 0.1 /100 | #285 | Tragic 12.8% |
| Spanish | 0.1 /100 | #286 | Tragic 12.8% |
| Hondurans | 0.1 /100 | #287 | Tragic 12.8% |
| French Canadians | 0.1 /100 | #288 | Tragic 12.8% |
| Iroquois | 0.0 /100 | #289 | Tragic 12.9% |
| Pima | 0.0 /100 | #290 | Tragic 12.9% |
| Immigrants | Honduras | 0.0 /100 | #291 | Tragic 12.9% |
| Scotch-Irish | 0.0 /100 | #292 | Tragic 12.9% |
| Jamaicans | 0.0 /100 | #293 | Tragic 12.9% |
| Apache | 0.0 /100 | #294 | Tragic 12.9% |
| Celtics | 0.0 /100 | #295 | Tragic 13.0% |
| Nicaraguans | 0.0 /100 | #296 | Tragic 13.0% |
| Natives/Alaskans | 0.0 /100 | #297 | Tragic 13.0% |
Demographics Similar to Eastern Europeans by Divorced or Separated
In terms of divorced or separated, the demographic groups most similar to Eastern Europeans are Immigrants from Yemen (11.3%, a difference of 0.010%), Immigrants from Philippines (11.3%, a difference of 0.070%), Immigrants from Vietnam (11.3%, a difference of 0.080%), Immigrants from Lithuania (11.3%, a difference of 0.11%), and Sri Lankan (11.3%, a difference of 0.14%).
| Demographics | Rating | Rank | Divorced or Separated |
| Immigrants | Poland | 100.0 /100 | #47 | Exceptional 11.2% |
| Immigrants | Turkey | 100.0 /100 | #48 | Exceptional 11.2% |
| Immigrants | Saudi Arabia | 100.0 /100 | #49 | Exceptional 11.2% |
| Bolivians | 100.0 /100 | #50 | Exceptional 11.2% |
| Immigrants | Bolivia | 100.0 /100 | #51 | Exceptional 11.3% |
| Immigrants | Australia | 99.9 /100 | #52 | Exceptional 11.3% |
| Immigrants | Lithuania | 99.9 /100 | #53 | Exceptional 11.3% |
| Eastern Europeans | 99.9 /100 | #54 | Exceptional 11.3% |
| Immigrants | Yemen | 99.9 /100 | #55 | Exceptional 11.3% |
| Immigrants | Philippines | 99.9 /100 | #56 | Exceptional 11.3% |
| Immigrants | Vietnam | 99.9 /100 | #57 | Exceptional 11.3% |
| Sri Lankans | 99.9 /100 | #58 | Exceptional 11.3% |
| Israelis | 99.9 /100 | #59 | Exceptional 11.3% |
| Immigrants | Russia | 99.9 /100 | #60 | Exceptional 11.3% |
| Koreans | 99.9 /100 | #61 | Exceptional 11.3% |