Swiss vs Immigrants from Argentina Currently Married
COMPARE
Swiss
Immigrants from Argentina
Currently Married
Currently Married Comparison
Swiss
Immigrants from Argentina
49.7%
CURRENTLY MARRIED
99.9/ 100
METRIC RATING
12th/ 347
METRIC RANK
47.0%
CURRENTLY MARRIED
72.0/ 100
METRIC RATING
147th/ 347
METRIC RANK
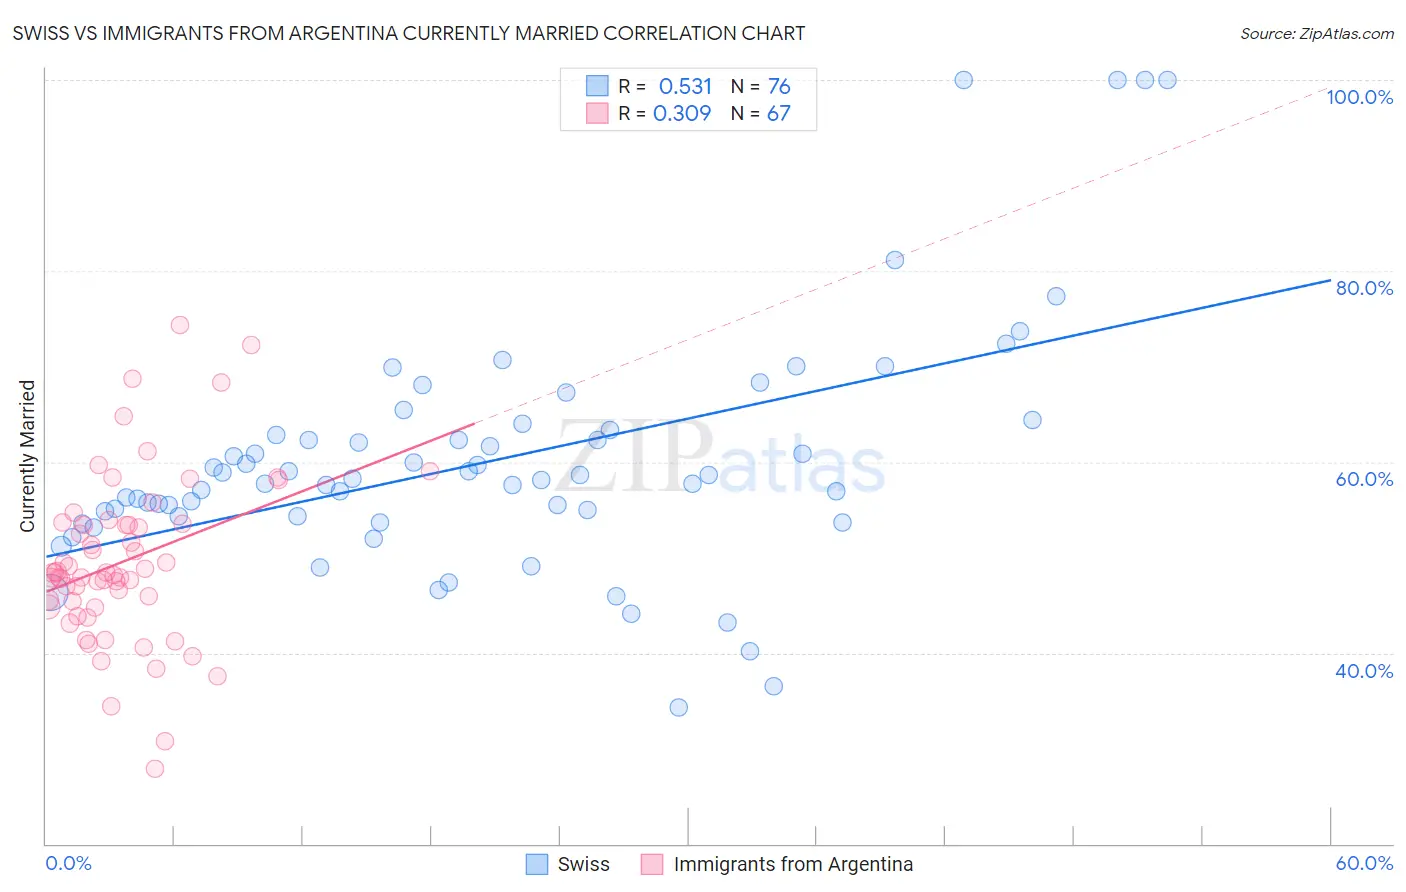
Swiss vs Immigrants from Argentina Currently Married Correlation Chart
The statistical analysis conducted on geographies consisting of 464,962,808 people shows a substantial positive correlation between the proportion of Swiss and percentage of population currently married in the United States with a correlation coefficient (R) of 0.531 and weighted average of 49.7%. Similarly, the statistical analysis conducted on geographies consisting of 264,414,041 people shows a mild positive correlation between the proportion of Immigrants from Argentina and percentage of population currently married in the United States with a correlation coefficient (R) of 0.309 and weighted average of 47.0%, a difference of 5.7%.
Currently Married Correlation Summary
| Measurement | Swiss | Immigrants from Argentina |
| Minimum | 34.3% | 27.9% |
| Maximum | 100.0% | 74.4% |
| Range | 65.7% | 46.5% |
| Mean | 60.1% | 49.6% |
| Median | 58.2% | 48.4% |
| Interquartile 25% (IQ1) | 54.3% | 44.8% |
| Interquartile 75% (IQ3) | 63.1% | 53.5% |
| Interquartile Range (IQR) | 8.8% | 8.7% |
| Standard Deviation (Sample) | 12.7% | 8.8% |
| Standard Deviation (Population) | 12.6% | 8.7% |
Similar Demographics by Currently Married
Demographics Similar to Swiss by Currently Married
In terms of currently married, the demographic groups most similar to Swiss are English (49.7%, a difference of 0.0%), Filipino (49.7%, a difference of 0.020%), Dutch (49.6%, a difference of 0.26%), Czech (49.9%, a difference of 0.27%), and German (49.6%, a difference of 0.28%).
| Demographics | Rating | Rank | Currently Married |
| Danes | 100.0 /100 | #5 | Exceptional 50.5% |
| Norwegians | 100.0 /100 | #6 | Exceptional 50.2% |
| Immigrants | South Central Asia | 100.0 /100 | #7 | Exceptional 50.0% |
| Swedes | 100.0 /100 | #8 | Exceptional 50.0% |
| Czechs | 99.9 /100 | #9 | Exceptional 49.9% |
| Filipinos | 99.9 /100 | #10 | Exceptional 49.7% |
| English | 99.9 /100 | #11 | Exceptional 49.7% |
| Swiss | 99.9 /100 | #12 | Exceptional 49.7% |
| Dutch | 99.9 /100 | #13 | Exceptional 49.6% |
| Germans | 99.9 /100 | #14 | Exceptional 49.6% |
| Pennsylvania Germans | 99.9 /100 | #15 | Exceptional 49.6% |
| Chinese | 99.9 /100 | #16 | Exceptional 49.5% |
| Scandinavians | 99.9 /100 | #17 | Exceptional 49.5% |
| Immigrants | Scotland | 99.8 /100 | #18 | Exceptional 49.3% |
| Europeans | 99.8 /100 | #19 | Exceptional 49.3% |
Demographics Similar to Immigrants from Argentina by Currently Married
In terms of currently married, the demographic groups most similar to Immigrants from Argentina are Carpatho Rusyn (47.0%, a difference of 0.030%), Immigrants from South Eastern Asia (47.1%, a difference of 0.040%), Hmong (47.1%, a difference of 0.060%), Cambodian (47.0%, a difference of 0.070%), and Zimbabwean (47.0%, a difference of 0.090%).
| Demographics | Rating | Rank | Currently Married |
| Cajuns | 75.3 /100 | #140 | Good 47.1% |
| Venezuelans | 74.4 /100 | #141 | Good 47.1% |
| Argentineans | 74.4 /100 | #142 | Good 47.1% |
| Guamanians/Chamorros | 74.2 /100 | #143 | Good 47.1% |
| Hmong | 73.4 /100 | #144 | Good 47.1% |
| Immigrants | South Eastern Asia | 72.9 /100 | #145 | Good 47.1% |
| Carpatho Rusyns | 72.6 /100 | #146 | Good 47.0% |
| Immigrants | Argentina | 72.0 /100 | #147 | Good 47.0% |
| Cambodians | 70.4 /100 | #148 | Good 47.0% |
| Zimbabweans | 70.1 /100 | #149 | Good 47.0% |
| Immigrants | Turkey | 70.0 /100 | #150 | Good 47.0% |
| Chileans | 69.8 /100 | #151 | Good 47.0% |
| Immigrants | Serbia | 68.8 /100 | #152 | Good 47.0% |
| Immigrants | Venezuela | 68.6 /100 | #153 | Good 47.0% |
| Albanians | 68.6 /100 | #154 | Good 47.0% |