Swiss vs Mongolian Disability Age 65 to 74
COMPARE
Swiss
Mongolian
Disability Age 65 to 74
Disability Age 65 to 74 Comparison
Swiss
Mongolians
22.9%
DISABILITY AGE 65 TO 74
79.7/ 100
METRIC RATING
149th/ 347
METRIC RANK
21.8%
DISABILITY AGE 65 TO 74
99.0/ 100
METRIC RATING
75th/ 347
METRIC RANK
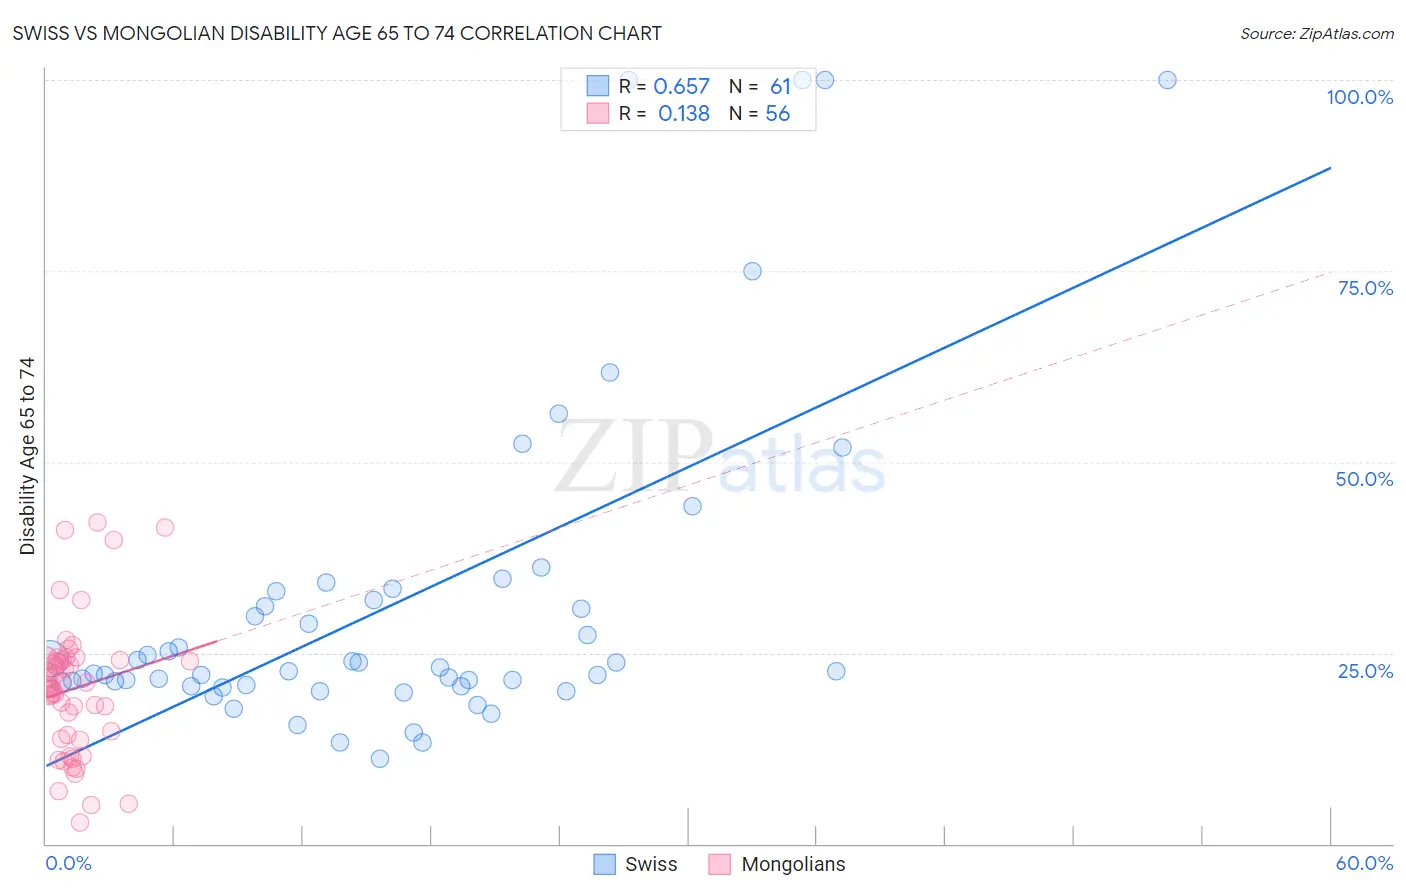
Swiss vs Mongolian Disability Age 65 to 74 Correlation Chart
The statistical analysis conducted on geographies consisting of 464,066,686 people shows a significant positive correlation between the proportion of Swiss and percentage of population with a disability between the ages 65 and 75 in the United States with a correlation coefficient (R) of 0.657 and weighted average of 22.9%. Similarly, the statistical analysis conducted on geographies consisting of 140,199,299 people shows a poor positive correlation between the proportion of Mongolians and percentage of population with a disability between the ages 65 and 75 in the United States with a correlation coefficient (R) of 0.138 and weighted average of 21.8%, a difference of 5.1%.
Disability Age 65 to 74 Correlation Summary
| Measurement | Swiss | Mongolian |
| Minimum | 11.1% | 2.8% |
| Maximum | 100.0% | 42.1% |
| Range | 88.9% | 39.3% |
| Mean | 31.5% | 20.3% |
| Median | 22.6% | 20.7% |
| Interquartile 25% (IQ1) | 20.7% | 14.0% |
| Interquartile 75% (IQ3) | 32.5% | 24.0% |
| Interquartile Range (IQR) | 11.8% | 10.0% |
| Standard Deviation (Sample) | 21.8% | 8.7% |
| Standard Deviation (Population) | 21.6% | 8.7% |
Similar Demographics by Disability Age 65 to 74
Demographics Similar to Swiss by Disability Age 65 to 74
In terms of disability age 65 to 74, the demographic groups most similar to Swiss are New Zealander (22.9%, a difference of 0.020%), Canadian (22.9%, a difference of 0.18%), Immigrants from Morocco (22.9%, a difference of 0.18%), Finnish (22.9%, a difference of 0.27%), and Immigrants from Uzbekistan (22.8%, a difference of 0.34%).
| Demographics | Rating | Rank | Disability Age 65 to 74 |
| Immigrants | Ethiopia | 85.3 /100 | #142 | Excellent 22.7% |
| Arabs | 84.8 /100 | #143 | Excellent 22.8% |
| Danes | 84.4 /100 | #144 | Excellent 22.8% |
| Immigrants | Uganda | 84.0 /100 | #145 | Excellent 22.8% |
| Alsatians | 83.7 /100 | #146 | Excellent 22.8% |
| Immigrants | Uzbekistan | 83.1 /100 | #147 | Excellent 22.8% |
| New Zealanders | 79.9 /100 | #148 | Good 22.9% |
| Swiss | 79.7 /100 | #149 | Good 22.9% |
| Canadians | 77.7 /100 | #150 | Good 22.9% |
| Immigrants | Morocco | 77.6 /100 | #151 | Good 22.9% |
| Finns | 76.5 /100 | #152 | Good 22.9% |
| Slavs | 75.2 /100 | #153 | Good 23.0% |
| Sri Lankans | 74.0 /100 | #154 | Good 23.0% |
| British | 73.9 /100 | #155 | Good 23.0% |
| Immigrants | Western Asia | 73.8 /100 | #156 | Good 23.0% |
Demographics Similar to Mongolians by Disability Age 65 to 74
In terms of disability age 65 to 74, the demographic groups most similar to Mongolians are Greek (21.8%, a difference of 0.010%), Cambodian (21.8%, a difference of 0.020%), Immigrants from Venezuela (21.8%, a difference of 0.030%), Immigrants from Poland (21.8%, a difference of 0.070%), and Immigrants from Eastern Europe (21.8%, a difference of 0.12%).
| Demographics | Rating | Rank | Disability Age 65 to 74 |
| Immigrants | Scotland | 99.3 /100 | #68 | Exceptional 21.7% |
| Immigrants | Egypt | 99.2 /100 | #69 | Exceptional 21.7% |
| Chinese | 99.2 /100 | #70 | Exceptional 21.7% |
| Immigrants | Belarus | 99.2 /100 | #71 | Exceptional 21.7% |
| Immigrants | Hungary | 99.2 /100 | #72 | Exceptional 21.7% |
| Immigrants | Venezuela | 99.0 /100 | #73 | Exceptional 21.8% |
| Cambodians | 99.0 /100 | #74 | Exceptional 21.8% |
| Mongolians | 99.0 /100 | #75 | Exceptional 21.8% |
| Greeks | 99.0 /100 | #76 | Exceptional 21.8% |
| Immigrants | Poland | 99.0 /100 | #77 | Exceptional 21.8% |
| Immigrants | Eastern Europe | 99.0 /100 | #78 | Exceptional 21.8% |
| Venezuelans | 99.0 /100 | #79 | Exceptional 21.8% |
| Immigrants | Norway | 98.9 /100 | #80 | Exceptional 21.8% |
| Croatians | 98.9 /100 | #81 | Exceptional 21.8% |
| Immigrants | Indonesia | 98.7 /100 | #82 | Exceptional 21.9% |