Immigrants from Barbados vs Immigrants from Albania Births to Unmarried Women
COMPARE
Immigrants from Barbados
Immigrants from Albania
Births to Unmarried Women
Births to Unmarried Women Comparison
Immigrants from Barbados
Immigrants from Albania
36.8%
BIRTHS TO UNMARRIED WOMEN
0.1/ 100
METRIC RATING
271st/ 347
METRIC RANK
28.0%
BIRTHS TO UNMARRIED WOMEN
99.2/ 100
METRIC RATING
58th/ 347
METRIC RANK
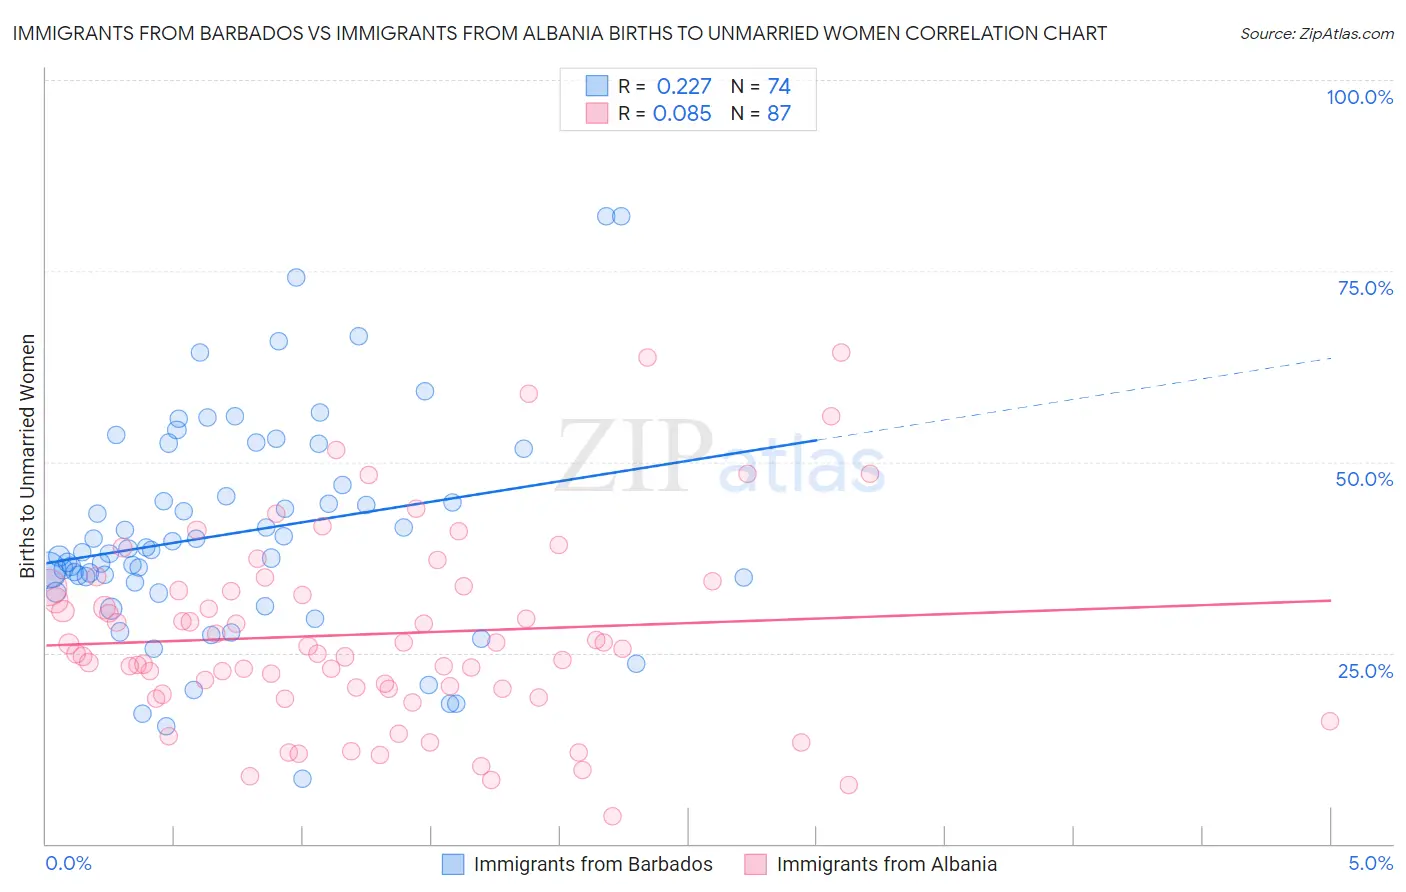
Immigrants from Barbados vs Immigrants from Albania Births to Unmarried Women Correlation Chart
The statistical analysis conducted on geographies consisting of 110,431,474 people shows a weak positive correlation between the proportion of Immigrants from Barbados and percentage of births to unmarried women in the United States with a correlation coefficient (R) of 0.227 and weighted average of 36.8%. Similarly, the statistical analysis conducted on geographies consisting of 114,601,314 people shows a slight positive correlation between the proportion of Immigrants from Albania and percentage of births to unmarried women in the United States with a correlation coefficient (R) of 0.085 and weighted average of 28.0%, a difference of 31.2%.
Births to Unmarried Women Correlation Summary
| Measurement | Immigrants from Barbados | Immigrants from Albania |
| Minimum | 8.5% | 3.6% |
| Maximum | 82.2% | 64.4% |
| Range | 73.7% | 60.8% |
| Mean | 40.7% | 27.4% |
| Median | 38.4% | 25.6% |
| Interquartile 25% (IQ1) | 34.3% | 20.3% |
| Interquartile 75% (IQ3) | 47.0% | 33.6% |
| Interquartile Range (IQR) | 12.7% | 13.3% |
| Standard Deviation (Sample) | 14.4% | 12.6% |
| Standard Deviation (Population) | 14.3% | 12.5% |
Similar Demographics by Births to Unmarried Women
Demographics Similar to Immigrants from Barbados by Births to Unmarried Women
In terms of births to unmarried women, the demographic groups most similar to Immigrants from Barbados are Immigrants from Congo (36.8%, a difference of 0.030%), Senegalese (36.8%, a difference of 0.10%), Comanche (36.7%, a difference of 0.22%), Choctaw (36.9%, a difference of 0.22%), and Central American (36.7%, a difference of 0.23%).
| Demographics | Rating | Rank | Births to Unmarried Women |
| Sub-Saharan Africans | 0.1 /100 | #264 | Tragic 36.7% |
| Cherokee | 0.1 /100 | #265 | Tragic 36.7% |
| Immigrants | Senegal | 0.1 /100 | #266 | Tragic 36.7% |
| Central Americans | 0.1 /100 | #267 | Tragic 36.7% |
| Comanche | 0.1 /100 | #268 | Tragic 36.7% |
| Senegalese | 0.1 /100 | #269 | Tragic 36.8% |
| Immigrants | Congo | 0.1 /100 | #270 | Tragic 36.8% |
| Immigrants | Barbados | 0.1 /100 | #271 | Tragic 36.8% |
| Choctaw | 0.1 /100 | #272 | Tragic 36.9% |
| Mexicans | 0.1 /100 | #273 | Tragic 36.9% |
| Cree | 0.1 /100 | #274 | Tragic 37.0% |
| Barbadians | 0.1 /100 | #275 | Tragic 37.0% |
| Belizeans | 0.1 /100 | #276 | Tragic 37.0% |
| Guatemalans | 0.1 /100 | #277 | Tragic 37.1% |
| Immigrants | Latin America | 0.1 /100 | #278 | Tragic 37.1% |
Demographics Similar to Immigrants from Albania by Births to Unmarried Women
In terms of births to unmarried women, the demographic groups most similar to Immigrants from Albania are Russian (28.0%, a difference of 0.11%), Immigrants from Belgium (28.0%, a difference of 0.24%), Immigrants from Kazakhstan (28.1%, a difference of 0.25%), Immigrants from Turkey (28.1%, a difference of 0.29%), and Immigrants from North Macedonia (28.1%, a difference of 0.34%).
| Demographics | Rating | Rank | Births to Unmarried Women |
| Macedonians | 99.4 /100 | #51 | Exceptional 27.9% |
| Bhutanese | 99.4 /100 | #52 | Exceptional 27.9% |
| Immigrants | Romania | 99.4 /100 | #53 | Exceptional 27.9% |
| Afghans | 99.4 /100 | #54 | Exceptional 27.9% |
| Mongolians | 99.3 /100 | #55 | Exceptional 27.9% |
| Immigrants | Belgium | 99.3 /100 | #56 | Exceptional 28.0% |
| Russians | 99.2 /100 | #57 | Exceptional 28.0% |
| Immigrants | Albania | 99.2 /100 | #58 | Exceptional 28.0% |
| Immigrants | Kazakhstan | 99.1 /100 | #59 | Exceptional 28.1% |
| Immigrants | Turkey | 99.1 /100 | #60 | Exceptional 28.1% |
| Immigrants | North Macedonia | 99.1 /100 | #61 | Exceptional 28.1% |
| Egyptians | 99.0 /100 | #62 | Exceptional 28.2% |
| Immigrants | Serbia | 98.9 /100 | #63 | Exceptional 28.3% |
| Tongans | 98.8 /100 | #64 | Exceptional 28.4% |
| Immigrants | Czechoslovakia | 98.8 /100 | #65 | Exceptional 28.4% |