Russian vs Belgian Family Households with Children
COMPARE
Russian
Belgian
Family Households with Children
Family Households with Children Comparison
Russians
Belgians
26.5%
FAMILY HOUSEHOLDS WITH CHILDREN
0.2/ 100
METRIC RATING
288th/ 347
METRIC RANK
26.9%
FAMILY HOUSEHOLDS WITH CHILDREN
2.1/ 100
METRIC RATING
250th/ 347
METRIC RANK
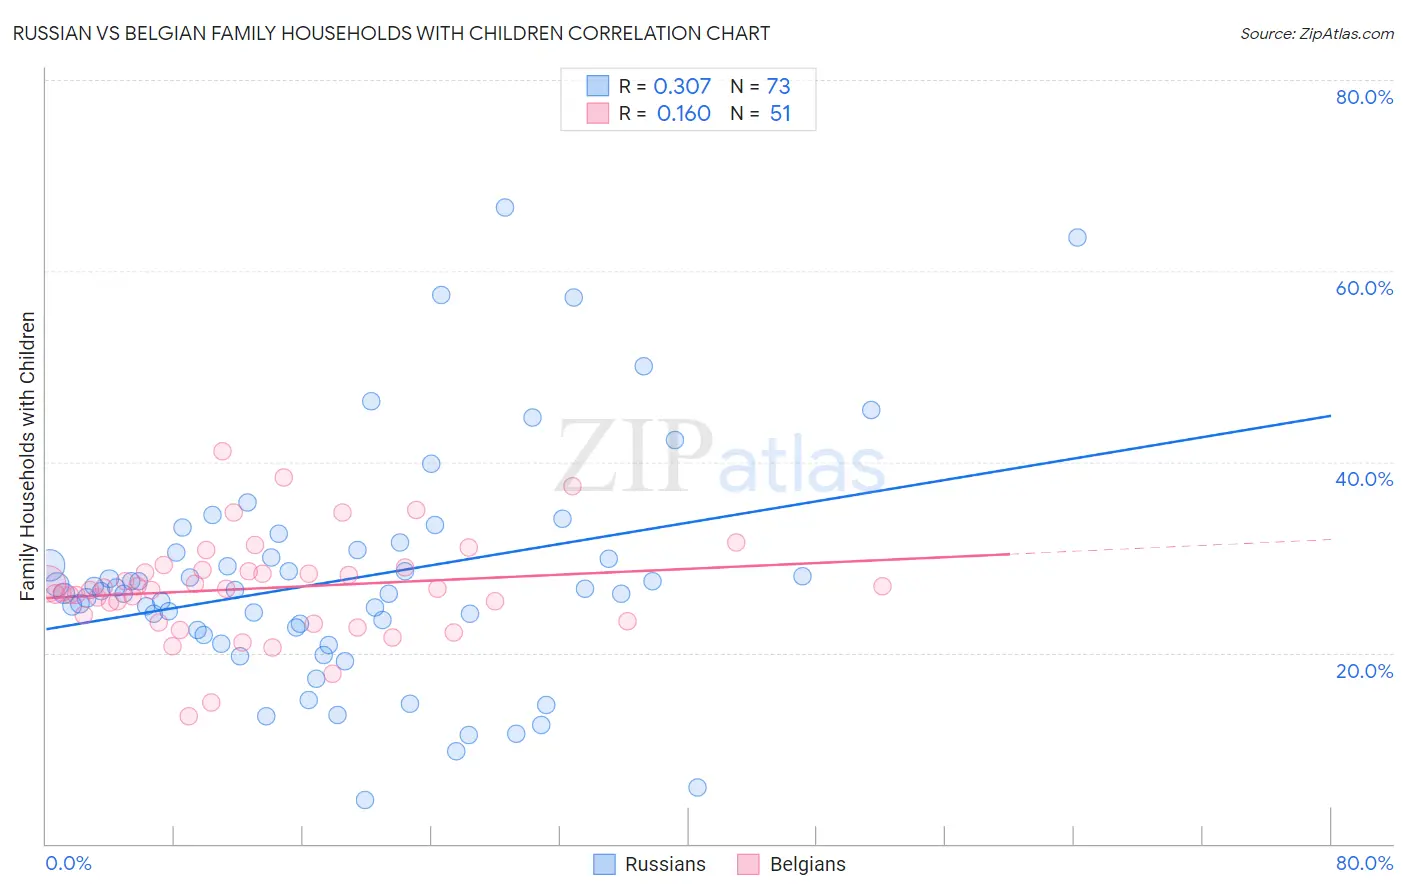
Russian vs Belgian Family Households with Children Correlation Chart
The statistical analysis conducted on geographies consisting of 511,427,529 people shows a mild positive correlation between the proportion of Russians and percentage of family households with children in the United States with a correlation coefficient (R) of 0.307 and weighted average of 26.5%. Similarly, the statistical analysis conducted on geographies consisting of 355,692,100 people shows a poor positive correlation between the proportion of Belgians and percentage of family households with children in the United States with a correlation coefficient (R) of 0.160 and weighted average of 26.9%, a difference of 1.3%.
Family Households with Children Correlation Summary
| Measurement | Russian | Belgian |
| Minimum | 4.6% | 13.4% |
| Maximum | 66.7% | 41.1% |
| Range | 62.1% | 27.7% |
| Mean | 27.7% | 26.8% |
| Median | 26.5% | 26.6% |
| Interquartile 25% (IQ1) | 22.2% | 23.3% |
| Interquartile 75% (IQ3) | 30.6% | 28.6% |
| Interquartile Range (IQR) | 8.5% | 5.4% |
| Standard Deviation (Sample) | 12.0% | 5.3% |
| Standard Deviation (Population) | 11.9% | 5.2% |
Similar Demographics by Family Households with Children
Demographics Similar to Russians by Family Households with Children
In terms of family households with children, the demographic groups most similar to Russians are Immigrants from Senegal (26.5%, a difference of 0.020%), Shoshone (26.5%, a difference of 0.020%), Immigrants from Sweden (26.5%, a difference of 0.050%), Cambodian (26.5%, a difference of 0.070%), and Immigrants from Canada (26.5%, a difference of 0.10%).
| Demographics | Rating | Rank | Family Households with Children |
| Lithuanians | 0.3 /100 | #281 | Tragic 26.6% |
| French American Indians | 0.3 /100 | #282 | Tragic 26.6% |
| Immigrants | North America | 0.3 /100 | #283 | Tragic 26.6% |
| Immigrants | Canada | 0.3 /100 | #284 | Tragic 26.5% |
| Cambodians | 0.2 /100 | #285 | Tragic 26.5% |
| Immigrants | Senegal | 0.2 /100 | #286 | Tragic 26.5% |
| Shoshone | 0.2 /100 | #287 | Tragic 26.5% |
| Russians | 0.2 /100 | #288 | Tragic 26.5% |
| Immigrants | Sweden | 0.2 /100 | #289 | Tragic 26.5% |
| Albanians | 0.2 /100 | #290 | Tragic 26.5% |
| Bahamians | 0.2 /100 | #291 | Tragic 26.5% |
| Poles | 0.2 /100 | #292 | Tragic 26.5% |
| Blacks/African Americans | 0.1 /100 | #293 | Tragic 26.5% |
| Latvians | 0.1 /100 | #294 | Tragic 26.4% |
| Macedonians | 0.1 /100 | #295 | Tragic 26.4% |
Demographics Similar to Belgians by Family Households with Children
In terms of family households with children, the demographic groups most similar to Belgians are Immigrants from Eastern Europe (26.9%, a difference of 0.010%), Immigrants from Kazakhstan (26.9%, a difference of 0.020%), Potawatomi (26.9%, a difference of 0.030%), Immigrants from Bosnia and Herzegovina (26.8%, a difference of 0.060%), and Irish (26.8%, a difference of 0.090%).
| Demographics | Rating | Rank | Family Households with Children |
| Immigrants | Saudi Arabia | 2.9 /100 | #243 | Tragic 26.9% |
| Ukrainians | 2.9 /100 | #244 | Tragic 26.9% |
| Australians | 2.8 /100 | #245 | Tragic 26.9% |
| Jamaicans | 2.5 /100 | #246 | Tragic 26.9% |
| Potawatomi | 2.2 /100 | #247 | Tragic 26.9% |
| Immigrants | Kazakhstan | 2.2 /100 | #248 | Tragic 26.9% |
| Immigrants | Eastern Europe | 2.1 /100 | #249 | Tragic 26.9% |
| Belgians | 2.1 /100 | #250 | Tragic 26.9% |
| Immigrants | Bosnia and Herzegovina | 1.9 /100 | #251 | Tragic 26.8% |
| Irish | 1.8 /100 | #252 | Tragic 26.8% |
| Italians | 1.5 /100 | #253 | Tragic 26.8% |
| Immigrants | Scotland | 1.5 /100 | #254 | Tragic 26.8% |
| German Russians | 1.5 /100 | #255 | Tragic 26.8% |
| Scotch-Irish | 1.4 /100 | #256 | Tragic 26.8% |
| Slavs | 1.3 /100 | #257 | Tragic 26.8% |