Spanish American vs Malaysian 6th Grade
COMPARE
Spanish American
Malaysian
6th Grade
6th Grade Comparison
Spanish Americans
Malaysians
97.0%
6TH GRADE
33.5/ 100
METRIC RATING
184th/ 347
METRIC RANK
96.2%
6TH GRADE
0.0/ 100
METRIC RATING
288th/ 347
METRIC RANK
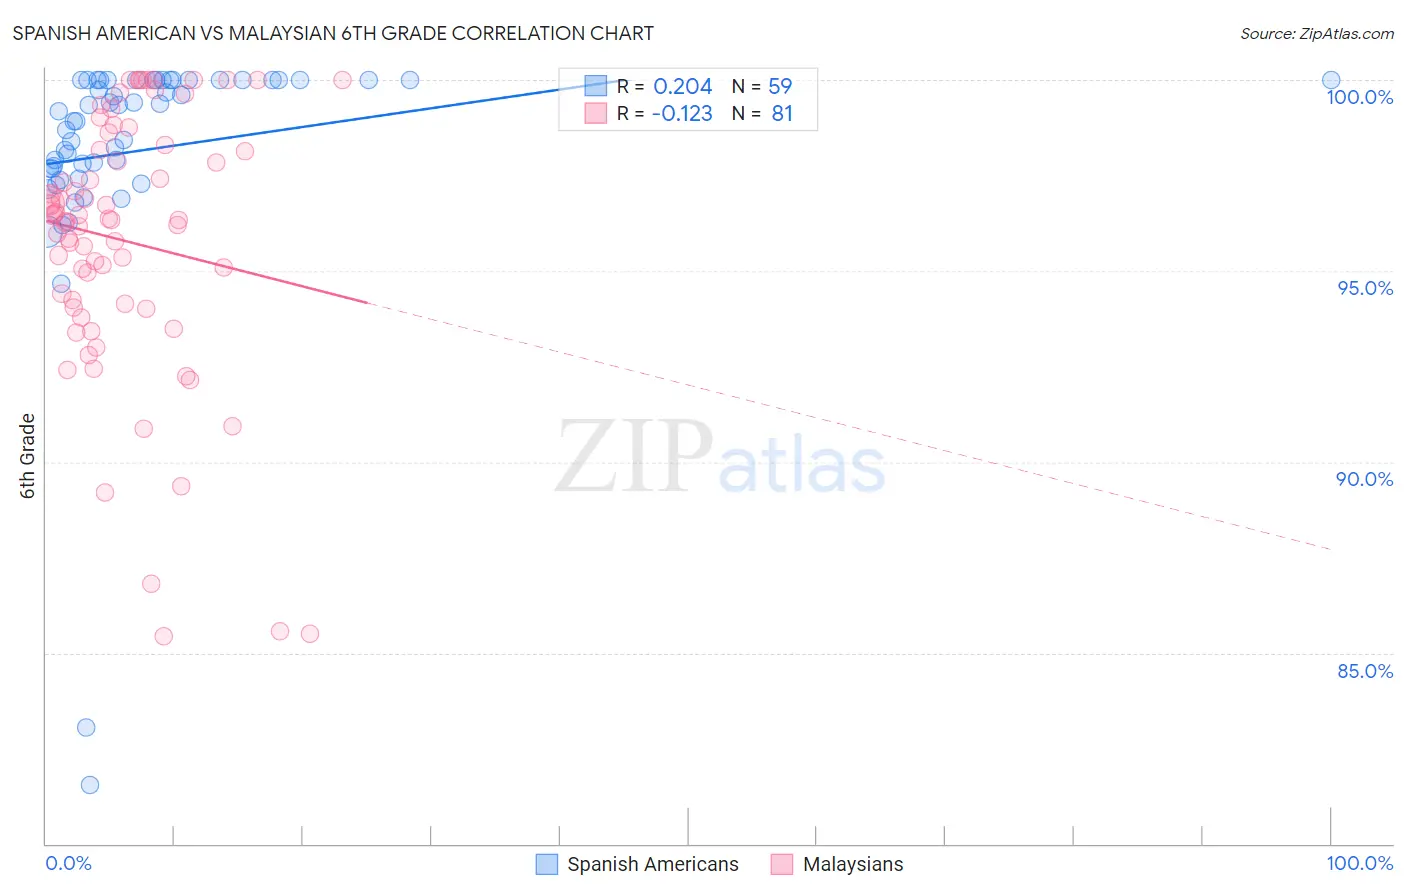
Spanish American vs Malaysian 6th Grade Correlation Chart
The statistical analysis conducted on geographies consisting of 103,168,542 people shows a weak positive correlation between the proportion of Spanish Americans and percentage of population with at least 6th grade education in the United States with a correlation coefficient (R) of 0.204 and weighted average of 97.0%. Similarly, the statistical analysis conducted on geographies consisting of 226,107,000 people shows a poor negative correlation between the proportion of Malaysians and percentage of population with at least 6th grade education in the United States with a correlation coefficient (R) of -0.123 and weighted average of 96.2%, a difference of 0.85%.
6th Grade Correlation Summary
| Measurement | Spanish American | Malaysian |
| Minimum | 81.5% | 85.4% |
| Maximum | 100.0% | 100.0% |
| Range | 18.5% | 14.6% |
| Mean | 98.2% | 95.8% |
| Median | 99.2% | 96.3% |
| Interquartile 25% (IQ1) | 97.7% | 94.1% |
| Interquartile 75% (IQ3) | 100.0% | 98.2% |
| Interquartile Range (IQR) | 2.3% | 4.2% |
| Standard Deviation (Sample) | 3.3% | 3.5% |
| Standard Deviation (Population) | 3.3% | 3.4% |
Similar Demographics by 6th Grade
Demographics Similar to Spanish Americans by 6th Grade
In terms of 6th grade, the demographic groups most similar to Spanish Americans are Immigrants from Venezuela (97.0%, a difference of 0.0%), Argentinean (97.0%, a difference of 0.0%), Immigrants from Ukraine (97.0%, a difference of 0.010%), Immigrants from Egypt (97.0%, a difference of 0.010%), and Comanche (97.0%, a difference of 0.020%).
| Demographics | Rating | Rank | 6th Grade |
| Mongolians | 46.7 /100 | #177 | Average 97.0% |
| Pakistanis | 46.0 /100 | #178 | Average 97.0% |
| Immigrants | Kenya | 45.3 /100 | #179 | Average 97.0% |
| Immigrants | Spain | 39.9 /100 | #180 | Fair 97.0% |
| Comanche | 37.9 /100 | #181 | Fair 97.0% |
| Immigrants | Ukraine | 35.6 /100 | #182 | Fair 97.0% |
| Immigrants | Venezuela | 34.5 /100 | #183 | Fair 97.0% |
| Spanish Americans | 33.5 /100 | #184 | Fair 97.0% |
| Argentineans | 33.0 /100 | #185 | Fair 97.0% |
| Immigrants | Egypt | 31.4 /100 | #186 | Fair 97.0% |
| Guamanians/Chamorros | 30.6 /100 | #187 | Fair 97.0% |
| Immigrants | Argentina | 30.4 /100 | #188 | Fair 97.0% |
| Blacks/African Americans | 30.2 /100 | #189 | Fair 97.0% |
| Dutch West Indians | 28.3 /100 | #190 | Fair 96.9% |
| Panamanians | 27.3 /100 | #191 | Fair 96.9% |
Demographics Similar to Malaysians by 6th Grade
In terms of 6th grade, the demographic groups most similar to Malaysians are Immigrants from Trinidad and Tobago (96.2%, a difference of 0.010%), Barbadian (96.2%, a difference of 0.020%), Immigrants from Eritrea (96.1%, a difference of 0.020%), Immigrants from Somalia (96.1%, a difference of 0.040%), and Immigrants from St. Vincent and the Grenadines (96.1%, a difference of 0.040%).
| Demographics | Rating | Rank | 6th Grade |
| Trinidadians and Tobagonians | 0.1 /100 | #281 | Tragic 96.2% |
| Houma | 0.1 /100 | #282 | Tragic 96.2% |
| Cubans | 0.1 /100 | #283 | Tragic 96.2% |
| Fijians | 0.1 /100 | #284 | Tragic 96.2% |
| Somalis | 0.1 /100 | #285 | Tragic 96.2% |
| Barbadians | 0.0 /100 | #286 | Tragic 96.2% |
| Immigrants | Trinidad and Tobago | 0.0 /100 | #287 | Tragic 96.2% |
| Malaysians | 0.0 /100 | #288 | Tragic 96.2% |
| Immigrants | Eritrea | 0.0 /100 | #289 | Tragic 96.1% |
| Immigrants | Somalia | 0.0 /100 | #290 | Tragic 96.1% |
| Immigrants | St. Vincent and the Grenadines | 0.0 /100 | #291 | Tragic 96.1% |
| Immigrants | Barbados | 0.0 /100 | #292 | Tragic 96.1% |
| Immigrants | West Indies | 0.0 /100 | #293 | Tragic 96.1% |
| British West Indians | 0.0 /100 | #294 | Tragic 96.0% |
| Immigrants | Grenada | 0.0 /100 | #295 | Tragic 95.9% |