Spanish American Indian vs Indian (Asian) Family Households
COMPARE
Spanish American Indian
Indian (Asian)
Family Households
Family Households Comparison
Spanish American Indians
Indians (Asian)
71.2%
FAMILY HOUSEHOLDS
100.0/ 100
METRIC RATING
2nd/ 347
METRIC RANK
65.1%
FAMILY HOUSEHOLDS
97.9/ 100
METRIC RATING
103rd/ 347
METRIC RANK
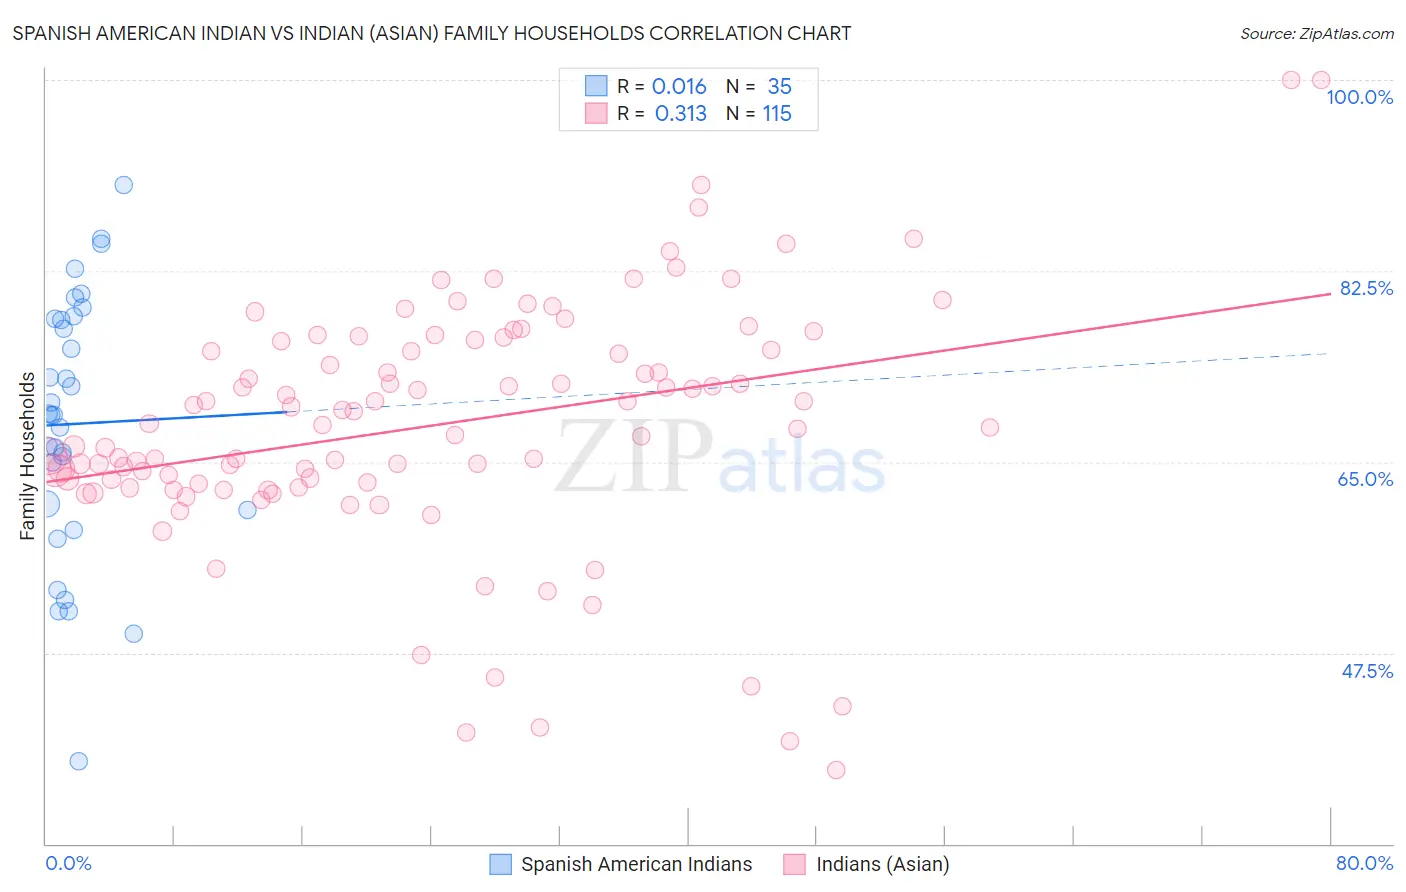
Spanish American Indian vs Indian (Asian) Family Households Correlation Chart
The statistical analysis conducted on geographies consisting of 73,145,550 people shows no correlation between the proportion of Spanish American Indians and percentage of family households in the United States with a correlation coefficient (R) of 0.016 and weighted average of 71.2%. Similarly, the statistical analysis conducted on geographies consisting of 494,783,710 people shows a mild positive correlation between the proportion of Indians (Asian) and percentage of family households in the United States with a correlation coefficient (R) of 0.313 and weighted average of 65.1%, a difference of 9.3%.
Family Households Correlation Summary
| Measurement | Spanish American Indian | Indian (Asian) |
| Minimum | 37.6% | 36.8% |
| Maximum | 90.4% | 100.0% |
| Range | 52.8% | 63.2% |
| Mean | 68.5% | 68.4% |
| Median | 69.3% | 68.4% |
| Interquartile 25% (IQ1) | 60.6% | 63.0% |
| Interquartile 75% (IQ3) | 78.1% | 76.1% |
| Interquartile Range (IQR) | 17.5% | 13.1% |
| Standard Deviation (Sample) | 11.9% | 11.2% |
| Standard Deviation (Population) | 11.8% | 11.2% |
Similar Demographics by Family Households
Demographics Similar to Spanish American Indians by Family Households
In terms of family households, the demographic groups most similar to Spanish American Indians are Yup'ik (72.4%, a difference of 1.8%), Tongan (69.6%, a difference of 2.2%), Yakama (69.3%, a difference of 2.7%), Yuman (69.3%, a difference of 2.7%), and Immigrants from Mexico (69.1%, a difference of 2.9%).
| Demographics | Rating | Rank | Family Households |
| Yup'ik | 100 /100 | #1 | Exceptional 72.4% |
| Spanish American Indians | 100.0 /100 | #2 | Exceptional 71.2% |
| Tongans | 100.0 /100 | #3 | Exceptional 69.6% |
| Yakama | 100.0 /100 | #4 | Exceptional 69.3% |
| Yuman | 100.0 /100 | #5 | Exceptional 69.3% |
| Immigrants | Mexico | 100.0 /100 | #6 | Exceptional 69.1% |
| Mexicans | 100.0 /100 | #7 | Exceptional 69.0% |
| Immigrants | Fiji | 100.0 /100 | #8 | Exceptional 68.8% |
| Native Hawaiians | 100.0 /100 | #9 | Exceptional 68.4% |
| Immigrants | Philippines | 100.0 /100 | #10 | Exceptional 68.3% |
| Immigrants | Central America | 100.0 /100 | #11 | Exceptional 68.3% |
| Koreans | 100.0 /100 | #12 | Exceptional 68.3% |
| Pueblo | 100.0 /100 | #13 | Exceptional 68.2% |
| Immigrants | Cuba | 100.0 /100 | #14 | Exceptional 68.2% |
| Assyrians/Chaldeans/Syriacs | 100.0 /100 | #15 | Exceptional 68.2% |
Demographics Similar to Indians (Asian) by Family Households
In terms of family households, the demographic groups most similar to Indians (Asian) are Spaniard (65.1%, a difference of 0.010%), Immigrants from Sri Lanka (65.1%, a difference of 0.020%), Haitian (65.2%, a difference of 0.040%), Chilean (65.2%, a difference of 0.040%), and English (65.1%, a difference of 0.070%).
| Demographics | Rating | Rank | Family Households |
| Swiss | 98.6 /100 | #96 | Exceptional 65.2% |
| Guatemalans | 98.6 /100 | #97 | Exceptional 65.2% |
| Immigrants | Syria | 98.4 /100 | #98 | Exceptional 65.2% |
| Central American Indians | 98.3 /100 | #99 | Exceptional 65.2% |
| Haitians | 98.1 /100 | #100 | Exceptional 65.2% |
| Chileans | 98.1 /100 | #101 | Exceptional 65.2% |
| Immigrants | Sri Lanka | 98.0 /100 | #102 | Exceptional 65.1% |
| Indians (Asian) | 97.9 /100 | #103 | Exceptional 65.1% |
| Spaniards | 97.8 /100 | #104 | Exceptional 65.1% |
| English | 97.4 /100 | #105 | Exceptional 65.1% |
| Whites/Caucasians | 97.3 /100 | #106 | Exceptional 65.1% |
| Alaska Natives | 97.3 /100 | #107 | Exceptional 65.1% |
| Palestinians | 97.2 /100 | #108 | Exceptional 65.1% |
| Immigrants | Guatemala | 96.9 /100 | #109 | Exceptional 65.0% |
| Scandinavians | 96.8 /100 | #110 | Exceptional 65.0% |