French Canadian vs Bermudan Family Households
COMPARE
French Canadian
Bermudan
Family Households
Family Households Comparison
French Canadians
Bermudans
63.7%
FAMILY HOUSEHOLDS
5.4/ 100
METRIC RATING
223rd/ 347
METRIC RANK
62.2%
FAMILY HOUSEHOLDS
0.0/ 100
METRIC RATING
305th/ 347
METRIC RANK
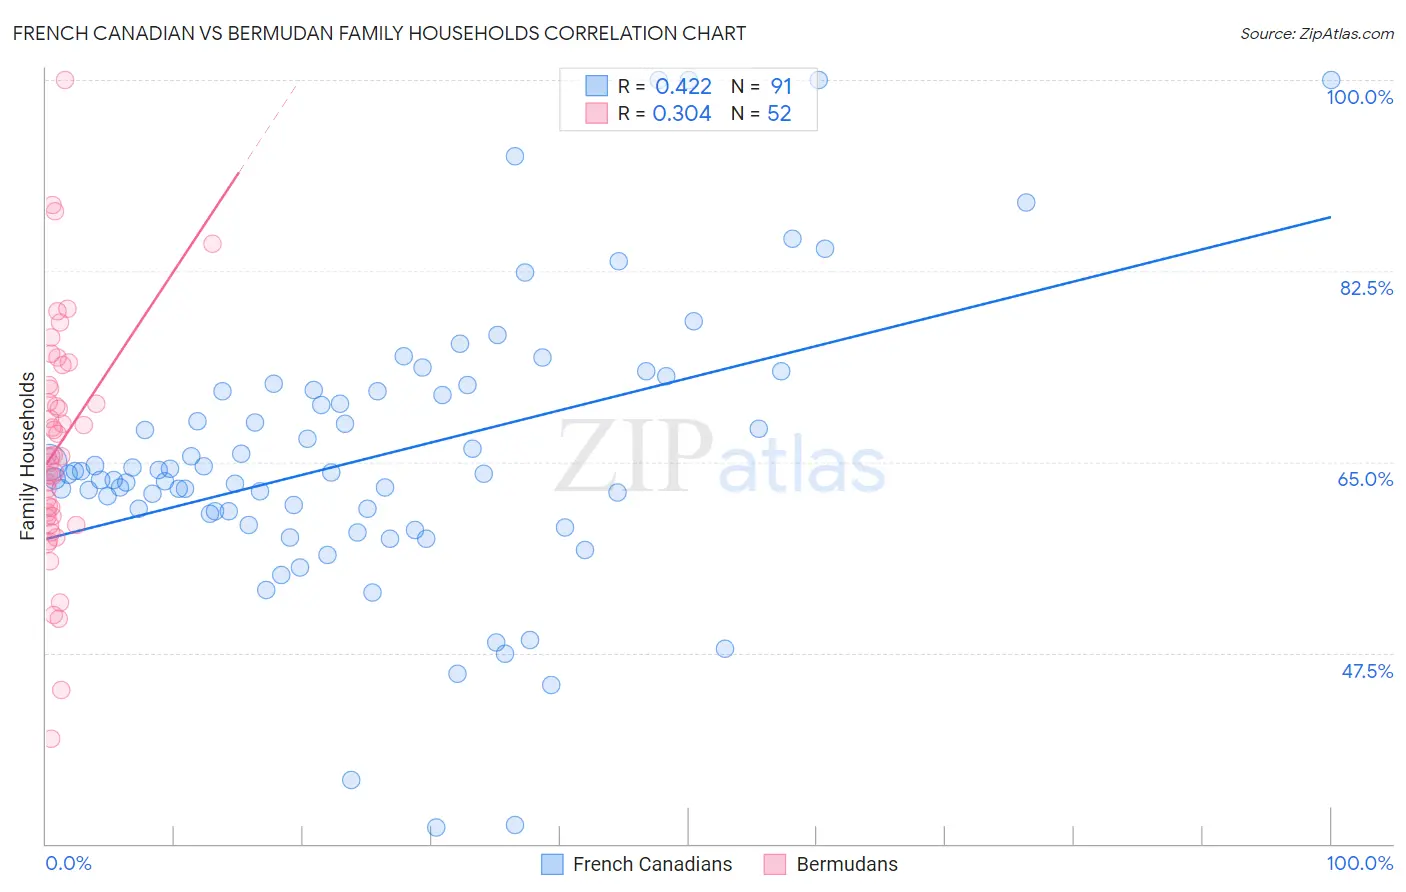
French Canadian vs Bermudan Family Households Correlation Chart
The statistical analysis conducted on geographies consisting of 502,269,037 people shows a moderate positive correlation between the proportion of French Canadians and percentage of family households in the United States with a correlation coefficient (R) of 0.422 and weighted average of 63.7%. Similarly, the statistical analysis conducted on geographies consisting of 55,716,623 people shows a mild positive correlation between the proportion of Bermudans and percentage of family households in the United States with a correlation coefficient (R) of 0.304 and weighted average of 62.2%, a difference of 2.5%.
Family Households Correlation Summary
| Measurement | French Canadian | Bermudan |
| Minimum | 31.5% | 39.6% |
| Maximum | 100.0% | 100.0% |
| Range | 68.5% | 60.4% |
| Mean | 65.5% | 66.5% |
| Median | 63.9% | 65.5% |
| Interquartile 25% (IQ1) | 60.3% | 59.9% |
| Interquartile 75% (IQ3) | 71.5% | 71.8% |
| Interquartile Range (IQR) | 11.2% | 11.9% |
| Standard Deviation (Sample) | 12.9% | 10.9% |
| Standard Deviation (Population) | 12.9% | 10.8% |
Similar Demographics by Family Households
Demographics Similar to French Canadians by Family Households
In terms of family households, the demographic groups most similar to French Canadians are Immigrants from Belarus (63.7%, a difference of 0.010%), Immigrants from South Africa (63.7%, a difference of 0.040%), Immigrants from Europe (63.7%, a difference of 0.060%), Macedonian (63.7%, a difference of 0.070%), and Turkish (63.6%, a difference of 0.070%).
| Demographics | Rating | Rank | Family Households |
| Croatians | 7.3 /100 | #216 | Tragic 63.8% |
| Osage | 7.0 /100 | #217 | Tragic 63.7% |
| Marshallese | 6.9 /100 | #218 | Tragic 63.7% |
| Macedonians | 6.5 /100 | #219 | Tragic 63.7% |
| Immigrants | Europe | 6.4 /100 | #220 | Tragic 63.7% |
| Immigrants | South Africa | 5.9 /100 | #221 | Tragic 63.7% |
| Immigrants | Belarus | 5.5 /100 | #222 | Tragic 63.7% |
| French Canadians | 5.4 /100 | #223 | Tragic 63.7% |
| Turks | 4.5 /100 | #224 | Tragic 63.6% |
| Immigrants | Hungary | 4.3 /100 | #225 | Tragic 63.6% |
| Immigrants | Bahamas | 4.2 /100 | #226 | Tragic 63.6% |
| Trinidadians and Tobagonians | 4.1 /100 | #227 | Tragic 63.6% |
| Blackfeet | 3.6 /100 | #228 | Tragic 63.6% |
| Bulgarians | 3.4 /100 | #229 | Tragic 63.6% |
| Immigrants | Brazil | 3.0 /100 | #230 | Tragic 63.6% |
Demographics Similar to Bermudans by Family Households
In terms of family households, the demographic groups most similar to Bermudans are African (62.1%, a difference of 0.020%), Immigrants from Norway (62.1%, a difference of 0.10%), Chippewa (62.1%, a difference of 0.10%), Iroquois (62.2%, a difference of 0.15%), and Subsaharan African (62.1%, a difference of 0.16%).
| Demographics | Rating | Rank | Family Households |
| Immigrants | Spain | 0.0 /100 | #298 | Tragic 62.4% |
| Immigrants | Kuwait | 0.0 /100 | #299 | Tragic 62.4% |
| Immigrants | Africa | 0.0 /100 | #300 | Tragic 62.4% |
| Immigrants | Albania | 0.0 /100 | #301 | Tragic 62.4% |
| Immigrants | Kenya | 0.0 /100 | #302 | Tragic 62.3% |
| Cree | 0.0 /100 | #303 | Tragic 62.3% |
| Iroquois | 0.0 /100 | #304 | Tragic 62.2% |
| Bermudans | 0.0 /100 | #305 | Tragic 62.2% |
| Africans | 0.0 /100 | #306 | Tragic 62.1% |
| Immigrants | Norway | 0.0 /100 | #307 | Tragic 62.1% |
| Chippewa | 0.0 /100 | #308 | Tragic 62.1% |
| Sub-Saharan Africans | 0.0 /100 | #309 | Tragic 62.1% |
| Immigrants | Liberia | 0.0 /100 | #310 | Tragic 62.0% |
| Immigrants | Morocco | 0.0 /100 | #311 | Tragic 62.0% |
| Immigrants | Latvia | 0.0 /100 | #312 | Tragic 62.0% |