Bangladeshi vs Albanian Single Mother Households
COMPARE
Bangladeshi
Albanian
Single Mother Households
Single Mother Households Comparison
Bangladeshis
Albanians
8.1%
SINGLE MOTHER HOUSEHOLDS
0.0/ 100
METRIC RATING
312th/ 347
METRIC RANK
5.9%
SINGLE MOTHER HOUSEHOLDS
91.1/ 100
METRIC RATING
132nd/ 347
METRIC RANK
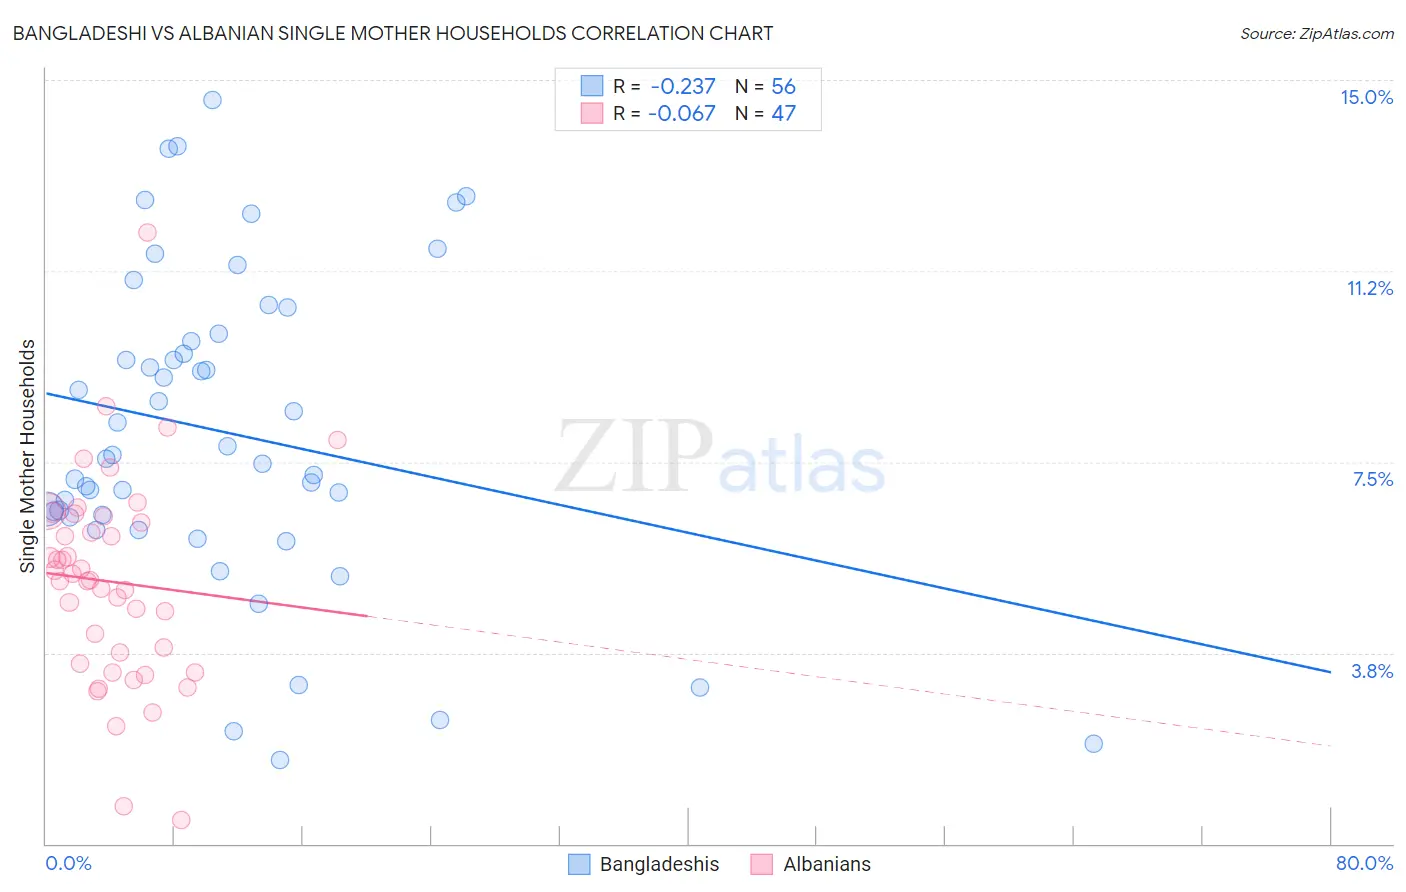
Bangladeshi vs Albanian Single Mother Households Correlation Chart
The statistical analysis conducted on geographies consisting of 141,271,331 people shows a weak negative correlation between the proportion of Bangladeshis and percentage of single mother households in the United States with a correlation coefficient (R) of -0.237 and weighted average of 8.1%. Similarly, the statistical analysis conducted on geographies consisting of 193,011,993 people shows a slight negative correlation between the proportion of Albanians and percentage of single mother households in the United States with a correlation coefficient (R) of -0.067 and weighted average of 5.9%, a difference of 37.7%.
Single Mother Households Correlation Summary
| Measurement | Bangladeshi | Albanian |
| Minimum | 1.7% | 0.45% |
| Maximum | 14.6% | 12.0% |
| Range | 13.0% | 11.6% |
| Mean | 8.1% | 5.1% |
| Median | 7.6% | 5.2% |
| Interquartile 25% (IQ1) | 6.4% | 3.5% |
| Interquartile 75% (IQ3) | 9.9% | 6.4% |
| Interquartile Range (IQR) | 3.5% | 2.9% |
| Standard Deviation (Sample) | 3.1% | 2.1% |
| Standard Deviation (Population) | 3.1% | 2.0% |
Similar Demographics by Single Mother Households
Demographics Similar to Bangladeshis by Single Mother Households
In terms of single mother households, the demographic groups most similar to Bangladeshis are Immigrants from Grenada (8.2%, a difference of 0.16%), Immigrants from Mexico (8.2%, a difference of 0.28%), Immigrants from Congo (8.1%, a difference of 0.29%), Immigrants from Western Africa (8.2%, a difference of 0.31%), and African (8.2%, a difference of 0.46%).
| Demographics | Rating | Rank | Single Mother Households |
| Colville | 0.0 /100 | #305 | Tragic 8.0% |
| Immigrants | Barbados | 0.0 /100 | #306 | Tragic 8.0% |
| Immigrants | St. Vincent and the Grenadines | 0.0 /100 | #307 | Tragic 8.0% |
| Immigrants | Central America | 0.0 /100 | #308 | Tragic 8.1% |
| Cheyenne | 0.0 /100 | #309 | Tragic 8.1% |
| Hondurans | 0.0 /100 | #310 | Tragic 8.1% |
| Immigrants | Congo | 0.0 /100 | #311 | Tragic 8.1% |
| Bangladeshis | 0.0 /100 | #312 | Tragic 8.1% |
| Immigrants | Grenada | 0.0 /100 | #313 | Tragic 8.2% |
| Immigrants | Mexico | 0.0 /100 | #314 | Tragic 8.2% |
| Immigrants | Western Africa | 0.0 /100 | #315 | Tragic 8.2% |
| Africans | 0.0 /100 | #316 | Tragic 8.2% |
| Immigrants | Honduras | 0.0 /100 | #317 | Tragic 8.2% |
| Senegalese | 0.0 /100 | #318 | Tragic 8.2% |
| Jamaicans | 0.0 /100 | #319 | Tragic 8.2% |
Demographics Similar to Albanians by Single Mother Households
In terms of single mother households, the demographic groups most similar to Albanians are Immigrants from Spain (5.9%, a difference of 0.040%), Egyptian (5.9%, a difference of 0.15%), Canadian (5.9%, a difference of 0.22%), Immigrants from Saudi Arabia (5.9%, a difference of 0.31%), and Palestinian (5.9%, a difference of 0.39%).
| Demographics | Rating | Rank | Single Mother Households |
| Slavs | 92.9 /100 | #125 | Exceptional 5.9% |
| Welsh | 92.8 /100 | #126 | Exceptional 5.9% |
| Lebanese | 92.4 /100 | #127 | Exceptional 5.9% |
| Czechoslovakians | 92.2 /100 | #128 | Exceptional 5.9% |
| Immigrants | Bolivia | 92.2 /100 | #129 | Exceptional 5.9% |
| Palestinians | 92.1 /100 | #130 | Exceptional 5.9% |
| Immigrants | Spain | 91.2 /100 | #131 | Exceptional 5.9% |
| Albanians | 91.1 /100 | #132 | Exceptional 5.9% |
| Egyptians | 90.7 /100 | #133 | Exceptional 5.9% |
| Canadians | 90.5 /100 | #134 | Exceptional 5.9% |
| Immigrants | Saudi Arabia | 90.2 /100 | #135 | Exceptional 5.9% |
| Jordanians | 88.9 /100 | #136 | Excellent 6.0% |
| Immigrants | Pakistan | 88.4 /100 | #137 | Excellent 6.0% |
| Icelanders | 86.9 /100 | #138 | Excellent 6.0% |
| Syrians | 86.0 /100 | #139 | Excellent 6.0% |