South African vs Norwegian Family Households with Children
COMPARE
South African
Norwegian
Family Households with Children
Family Households with Children Comparison
South Africans
Norwegians
27.4%
FAMILY HOUSEHOLDS WITH CHILDREN
44.9/ 100
METRIC RATING
183rd/ 347
METRIC RANK
27.4%
FAMILY HOUSEHOLDS WITH CHILDREN
35.0/ 100
METRIC RATING
197th/ 347
METRIC RANK
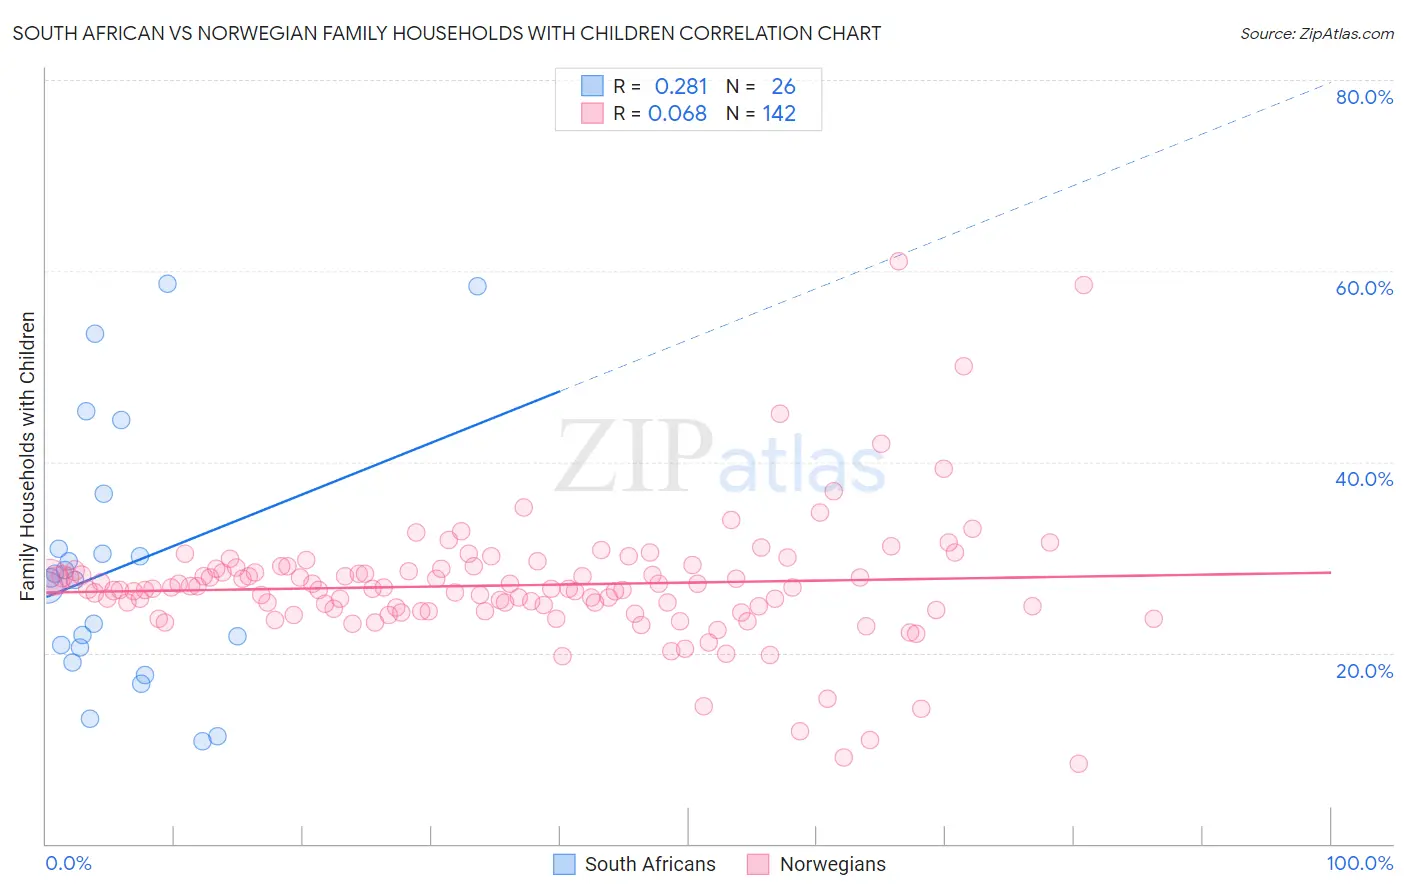
South African vs Norwegian Family Households with Children Correlation Chart
The statistical analysis conducted on geographies consisting of 182,473,583 people shows a weak positive correlation between the proportion of South Africans and percentage of family households with children in the United States with a correlation coefficient (R) of 0.281 and weighted average of 27.4%. Similarly, the statistical analysis conducted on geographies consisting of 532,567,428 people shows a slight positive correlation between the proportion of Norwegians and percentage of family households with children in the United States with a correlation coefficient (R) of 0.068 and weighted average of 27.4%, a difference of 0.23%.
Family Households with Children Correlation Summary
| Measurement | South African | Norwegian |
| Minimum | 10.7% | 8.3% |
| Maximum | 58.7% | 61.1% |
| Range | 47.9% | 52.7% |
| Mean | 29.0% | 27.1% |
| Median | 27.7% | 26.7% |
| Interquartile 25% (IQ1) | 20.5% | 24.5% |
| Interquartile 75% (IQ3) | 30.8% | 28.8% |
| Interquartile Range (IQR) | 10.3% | 4.2% |
| Standard Deviation (Sample) | 13.4% | 6.7% |
| Standard Deviation (Population) | 13.1% | 6.7% |
Demographics Similar to South Africans and Norwegians by Family Households with Children
In terms of family households with children, the demographic groups most similar to South Africans are Native Hawaiian (27.4%, a difference of 0.010%), Puget Sound Salish (27.4%, a difference of 0.030%), Aleut (27.4%, a difference of 0.040%), Immigrants from Turkey (27.4%, a difference of 0.050%), and Delaware (27.4%, a difference of 0.060%). Similarly, the demographic groups most similar to Norwegians are Cheyenne (27.4%, a difference of 0.0%), Immigrants from Romania (27.4%, a difference of 0.010%), Crow (27.4%, a difference of 0.020%), Immigrants from Iran (27.4%, a difference of 0.030%), and Swedish (27.4%, a difference of 0.050%).
| Demographics | Rating | Rank | Family Households with Children |
| Immigrants | Turkey | 46.9 /100 | #180 | Average 27.4% |
| Aleuts | 46.7 /100 | #181 | Average 27.4% |
| Puget Sound Salish | 46.2 /100 | #182 | Average 27.4% |
| South Africans | 44.9 /100 | #183 | Average 27.4% |
| Native Hawaiians | 44.6 /100 | #184 | Average 27.4% |
| Delaware | 42.0 /100 | #185 | Average 27.4% |
| Immigrants | Brazil | 40.6 /100 | #186 | Average 27.4% |
| Creek | 39.8 /100 | #187 | Fair 27.4% |
| Dutch | 38.8 /100 | #188 | Fair 27.4% |
| Immigrants | Israel | 37.9 /100 | #189 | Fair 27.4% |
| Immigrants | Uruguay | 37.7 /100 | #190 | Fair 27.4% |
| Sudanese | 37.6 /100 | #191 | Fair 27.4% |
| Pennsylvania Germans | 37.5 /100 | #192 | Fair 27.4% |
| Swedes | 36.9 /100 | #193 | Fair 27.4% |
| Immigrants | Iran | 36.1 /100 | #194 | Fair 27.4% |
| Crow | 35.7 /100 | #195 | Fair 27.4% |
| Cheyenne | 35.1 /100 | #196 | Fair 27.4% |
| Norwegians | 35.0 /100 | #197 | Fair 27.4% |
| Immigrants | Romania | 34.4 /100 | #198 | Fair 27.4% |
| English | 32.0 /100 | #199 | Fair 27.3% |
| Immigrants | Congo | 28.7 /100 | #200 | Fair 27.3% |