South African vs Immigrants from Taiwan Family Households with Children
COMPARE
South African
Immigrants from Taiwan
Family Households with Children
Family Households with Children Comparison
South Africans
Immigrants from Taiwan
27.4%
FAMILY HOUSEHOLDS WITH CHILDREN
44.9/ 100
METRIC RATING
183rd/ 347
METRIC RANK
29.0%
FAMILY HOUSEHOLDS WITH CHILDREN
100.0/ 100
METRIC RATING
44th/ 347
METRIC RANK
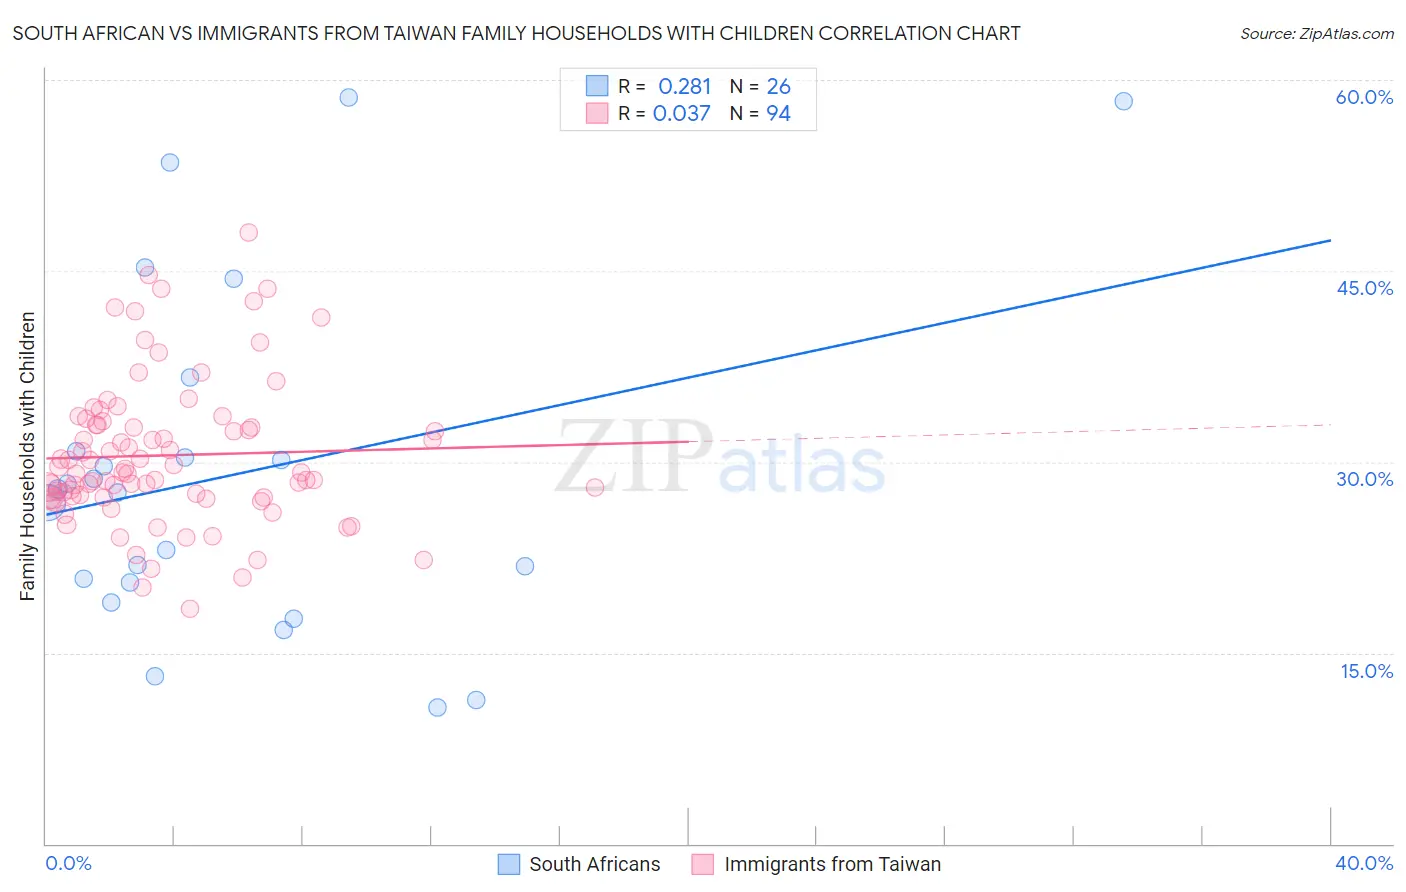
South African vs Immigrants from Taiwan Family Households with Children Correlation Chart
The statistical analysis conducted on geographies consisting of 182,473,583 people shows a weak positive correlation between the proportion of South Africans and percentage of family households with children in the United States with a correlation coefficient (R) of 0.281 and weighted average of 27.4%. Similarly, the statistical analysis conducted on geographies consisting of 298,050,529 people shows no correlation between the proportion of Immigrants from Taiwan and percentage of family households with children in the United States with a correlation coefficient (R) of 0.037 and weighted average of 29.0%, a difference of 5.9%.
Family Households with Children Correlation Summary
| Measurement | South African | Immigrants from Taiwan |
| Minimum | 10.7% | 18.5% |
| Maximum | 58.7% | 48.1% |
| Range | 47.9% | 29.6% |
| Mean | 29.0% | 30.5% |
| Median | 27.7% | 29.1% |
| Interquartile 25% (IQ1) | 20.5% | 27.2% |
| Interquartile 75% (IQ3) | 30.8% | 32.9% |
| Interquartile Range (IQR) | 10.3% | 5.7% |
| Standard Deviation (Sample) | 13.4% | 5.7% |
| Standard Deviation (Population) | 13.1% | 5.7% |
Similar Demographics by Family Households with Children
Demographics Similar to South Africans by Family Households with Children
In terms of family households with children, the demographic groups most similar to South Africans are Native Hawaiian (27.4%, a difference of 0.010%), Puget Sound Salish (27.4%, a difference of 0.030%), Aleut (27.4%, a difference of 0.040%), Turkish (27.4%, a difference of 0.050%), and Immigrants from Turkey (27.4%, a difference of 0.050%).
| Demographics | Rating | Rank | Family Households with Children |
| Immigrants | China | 49.6 /100 | #176 | Average 27.4% |
| Ugandans | 49.2 /100 | #177 | Average 27.4% |
| Spanish Americans | 48.9 /100 | #178 | Average 27.4% |
| Turks | 46.9 /100 | #179 | Average 27.4% |
| Immigrants | Turkey | 46.9 /100 | #180 | Average 27.4% |
| Aleuts | 46.7 /100 | #181 | Average 27.4% |
| Puget Sound Salish | 46.2 /100 | #182 | Average 27.4% |
| South Africans | 44.9 /100 | #183 | Average 27.4% |
| Native Hawaiians | 44.6 /100 | #184 | Average 27.4% |
| Delaware | 42.0 /100 | #185 | Average 27.4% |
| Immigrants | Brazil | 40.6 /100 | #186 | Average 27.4% |
| Creek | 39.8 /100 | #187 | Fair 27.4% |
| Dutch | 38.8 /100 | #188 | Fair 27.4% |
| Immigrants | Israel | 37.9 /100 | #189 | Fair 27.4% |
| Immigrants | Uruguay | 37.7 /100 | #190 | Fair 27.4% |
Demographics Similar to Immigrants from Taiwan by Family Households with Children
In terms of family households with children, the demographic groups most similar to Immigrants from Taiwan are Asian (29.1%, a difference of 0.040%), Fijian (29.0%, a difference of 0.060%), Immigrants from Philippines (29.0%, a difference of 0.14%), Peruvian (29.0%, a difference of 0.15%), and Apache (29.0%, a difference of 0.18%).
| Demographics | Rating | Rank | Family Households with Children |
| Immigrants | Cameroon | 100.0 /100 | #37 | Exceptional 29.2% |
| Koreans | 100.0 /100 | #38 | Exceptional 29.2% |
| Yaqui | 100.0 /100 | #39 | Exceptional 29.1% |
| Central Americans | 100.0 /100 | #40 | Exceptional 29.1% |
| Immigrants | South Eastern Asia | 100.0 /100 | #41 | Exceptional 29.1% |
| Spanish American Indians | 100.0 /100 | #42 | Exceptional 29.1% |
| Asians | 100.0 /100 | #43 | Exceptional 29.1% |
| Immigrants | Taiwan | 100.0 /100 | #44 | Exceptional 29.0% |
| Fijians | 100.0 /100 | #45 | Exceptional 29.0% |
| Immigrants | Philippines | 100.0 /100 | #46 | Exceptional 29.0% |
| Peruvians | 100.0 /100 | #47 | Exceptional 29.0% |
| Apache | 100.0 /100 | #48 | Exceptional 29.0% |
| Jordanians | 100.0 /100 | #49 | Exceptional 29.0% |
| Immigrants | Immigrants | 100.0 /100 | #50 | Exceptional 28.9% |
| Immigrants | Peru | 100.0 /100 | #51 | Exceptional 28.9% |