Somali vs Kiowa Single Father Households
COMPARE
Somali
Kiowa
Single Father Households
Single Father Households Comparison
Somalis
Kiowa
2.5%
SINGLE FATHER HOUSEHOLDS
2.1/ 100
METRIC RATING
250th/ 347
METRIC RANK
2.8%
SINGLE FATHER HOUSEHOLDS
0.0/ 100
METRIC RATING
300th/ 347
METRIC RANK
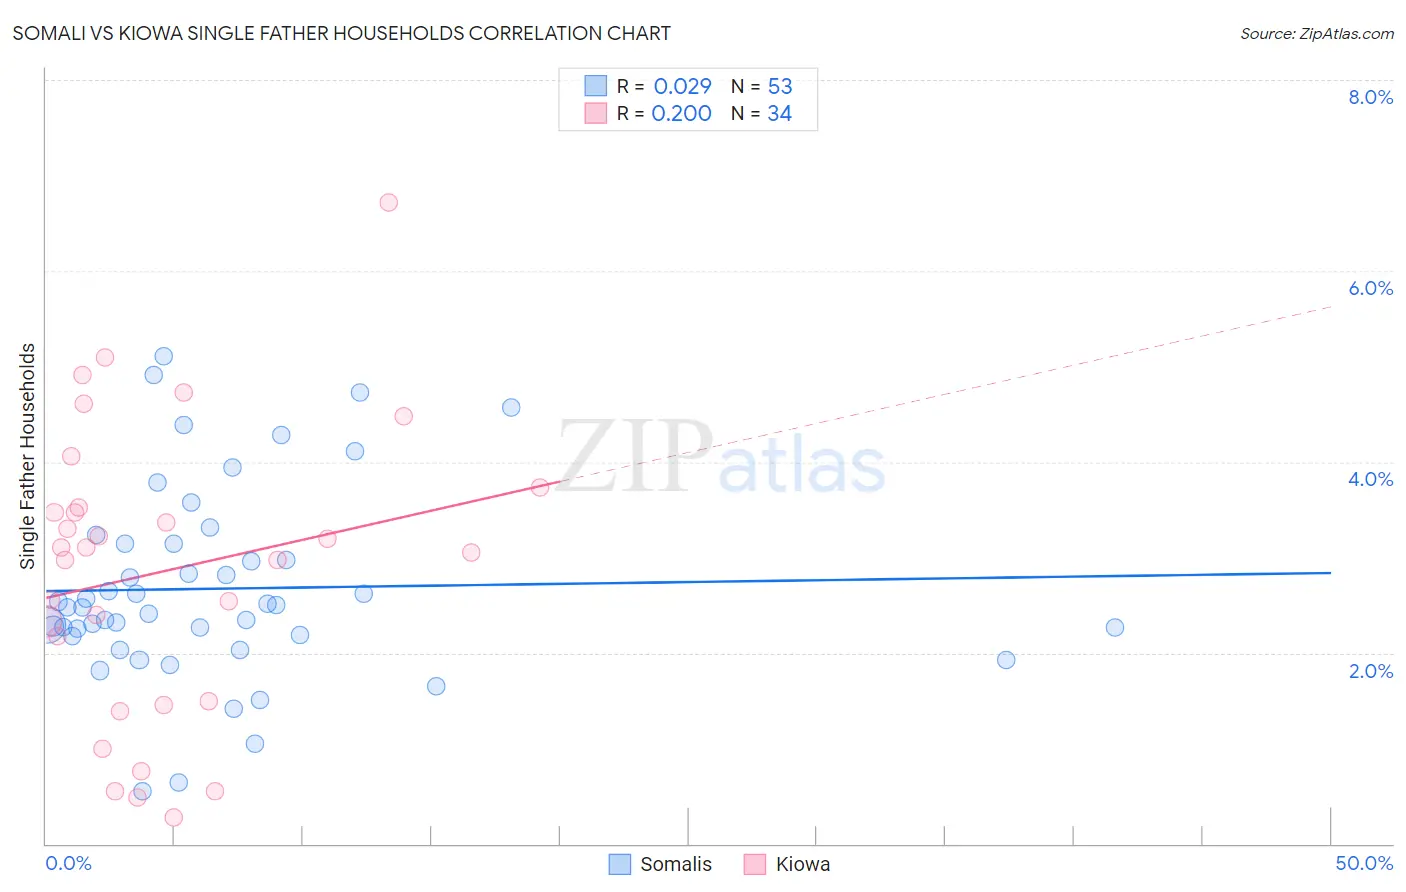
Somali vs Kiowa Single Father Households Correlation Chart
The statistical analysis conducted on geographies consisting of 99,117,058 people shows no correlation between the proportion of Somalis and percentage of single father households in the United States with a correlation coefficient (R) of 0.029 and weighted average of 2.5%. Similarly, the statistical analysis conducted on geographies consisting of 56,039,243 people shows a weak positive correlation between the proportion of Kiowa and percentage of single father households in the United States with a correlation coefficient (R) of 0.200 and weighted average of 2.8%, a difference of 11.4%.
Single Father Households Correlation Summary
| Measurement | Somali | Kiowa |
| Minimum | 0.55% | 0.27% |
| Maximum | 5.1% | 6.7% |
| Range | 4.5% | 6.4% |
| Mean | 2.7% | 2.9% |
| Median | 2.5% | 3.1% |
| Interquartile 25% (IQ1) | 2.2% | 1.5% |
| Interquartile 75% (IQ3) | 3.1% | 3.5% |
| Interquartile Range (IQR) | 0.97% | 2.0% |
| Standard Deviation (Sample) | 1.0% | 1.5% |
| Standard Deviation (Population) | 0.99% | 1.5% |
Similar Demographics by Single Father Households
Demographics Similar to Somalis by Single Father Households
In terms of single father households, the demographic groups most similar to Somalis are Liberian (2.5%, a difference of 0.090%), Immigrants from Eritrea (2.5%, a difference of 0.11%), Immigrants from Cameroon (2.5%, a difference of 0.17%), Immigrants from Somalia (2.5%, a difference of 0.18%), and Immigrants from Thailand (2.5%, a difference of 0.22%).
| Demographics | Rating | Rank | Single Father Households |
| Spaniards | 3.1 /100 | #243 | Tragic 2.5% |
| Immigrants | Middle Africa | 2.8 /100 | #244 | Tragic 2.5% |
| Basques | 2.5 /100 | #245 | Tragic 2.5% |
| Native Hawaiians | 2.5 /100 | #246 | Tragic 2.5% |
| Delaware | 2.5 /100 | #247 | Tragic 2.5% |
| Bahamians | 2.4 /100 | #248 | Tragic 2.5% |
| Immigrants | Cameroon | 2.3 /100 | #249 | Tragic 2.5% |
| Somalis | 2.1 /100 | #250 | Tragic 2.5% |
| Liberians | 2.0 /100 | #251 | Tragic 2.5% |
| Immigrants | Eritrea | 2.0 /100 | #252 | Tragic 2.5% |
| Immigrants | Somalia | 1.9 /100 | #253 | Tragic 2.5% |
| Immigrants | Thailand | 1.8 /100 | #254 | Tragic 2.5% |
| Tongans | 1.5 /100 | #255 | Tragic 2.5% |
| Potawatomi | 1.4 /100 | #256 | Tragic 2.5% |
| Immigrants | Congo | 1.2 /100 | #257 | Tragic 2.5% |
Demographics Similar to Kiowa by Single Father Households
In terms of single father households, the demographic groups most similar to Kiowa are Immigrants from Latin America (2.8%, a difference of 0.050%), Lumbee (2.8%, a difference of 0.40%), Spanish American (2.8%, a difference of 0.58%), Immigrants from Honduras (2.8%, a difference of 0.60%), and Cree (2.8%, a difference of 0.77%).
| Demographics | Rating | Rank | Single Father Households |
| Immigrants | Fiji | 0.0 /100 | #293 | Tragic 2.7% |
| Malaysians | 0.0 /100 | #294 | Tragic 2.7% |
| Chickasaw | 0.0 /100 | #295 | Tragic 2.8% |
| Japanese | 0.0 /100 | #296 | Tragic 2.8% |
| Hondurans | 0.0 /100 | #297 | Tragic 2.8% |
| Cree | 0.0 /100 | #298 | Tragic 2.8% |
| Lumbee | 0.0 /100 | #299 | Tragic 2.8% |
| Kiowa | 0.0 /100 | #300 | Tragic 2.8% |
| Immigrants | Latin America | 0.0 /100 | #301 | Tragic 2.8% |
| Spanish Americans | 0.0 /100 | #302 | Tragic 2.8% |
| Immigrants | Honduras | 0.0 /100 | #303 | Tragic 2.8% |
| Mexican American Indians | 0.0 /100 | #304 | Tragic 2.8% |
| Hispanics or Latinos | 0.0 /100 | #305 | Tragic 2.8% |
| Immigrants | Azores | 0.0 /100 | #306 | Tragic 2.8% |
| Hopi | 0.0 /100 | #307 | Tragic 2.8% |