Immigrants from Portugal vs Immigrants from Iraq Births to Unmarried Women
COMPARE
Immigrants from Portugal
Immigrants from Iraq
Births to Unmarried Women
Births to Unmarried Women Comparison
Immigrants from Portugal
Immigrants from Iraq
36.2%
BIRTHS TO UNMARRIED WOMEN
0.2/ 100
METRIC RATING
253rd/ 347
METRIC RANK
27.1%
BIRTHS TO UNMARRIED WOMEN
99.8/ 100
METRIC RATING
31st/ 347
METRIC RANK
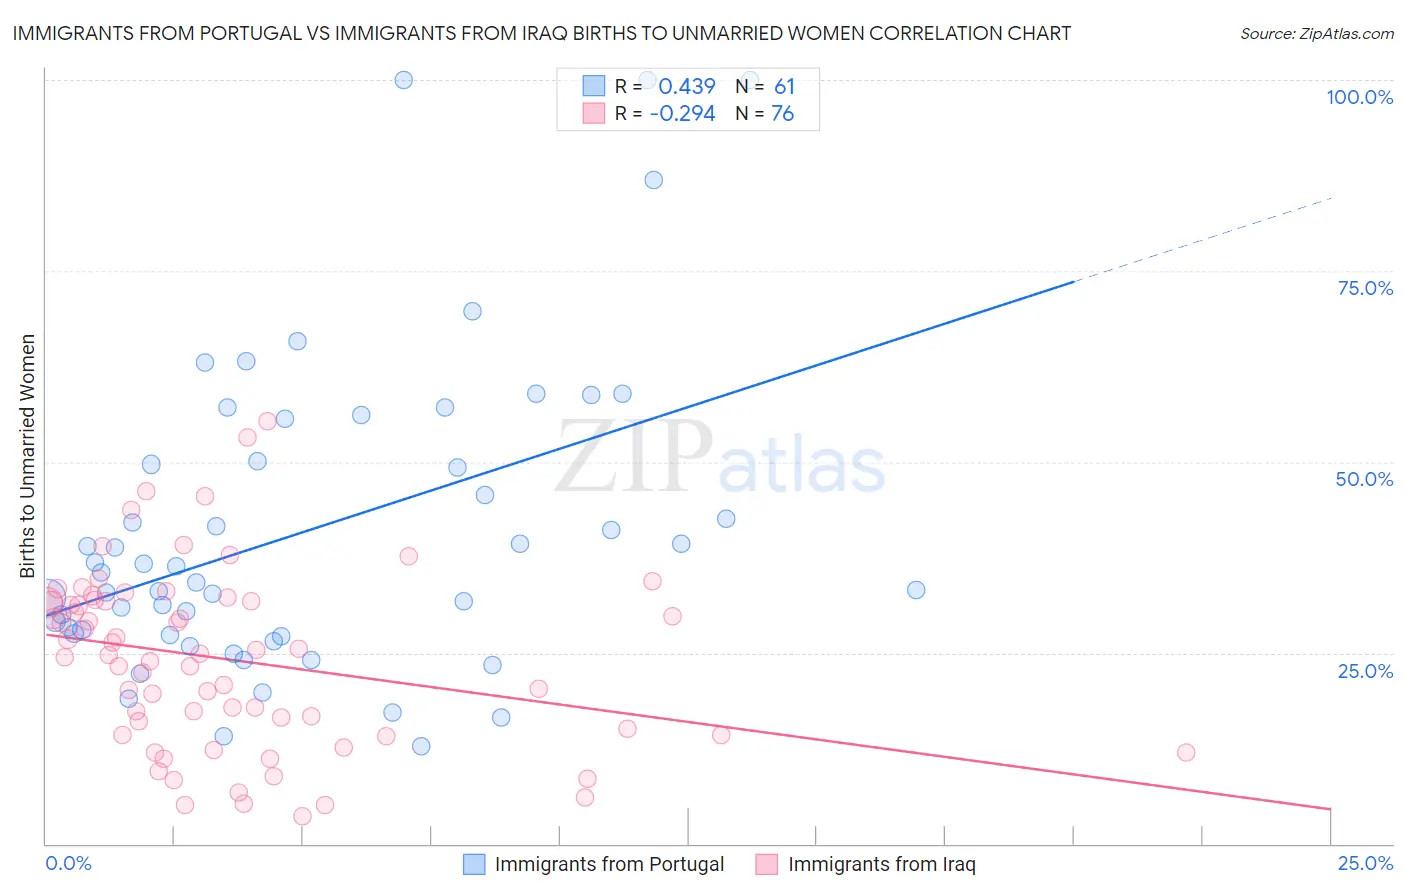
Immigrants from Portugal vs Immigrants from Iraq Births to Unmarried Women Correlation Chart
The statistical analysis conducted on geographies consisting of 165,718,772 people shows a moderate positive correlation between the proportion of Immigrants from Portugal and percentage of births to unmarried women in the United States with a correlation coefficient (R) of 0.439 and weighted average of 36.2%. Similarly, the statistical analysis conducted on geographies consisting of 187,409,646 people shows a weak negative correlation between the proportion of Immigrants from Iraq and percentage of births to unmarried women in the United States with a correlation coefficient (R) of -0.294 and weighted average of 27.1%, a difference of 33.2%.
Births to Unmarried Women Correlation Summary
| Measurement | Immigrants from Portugal | Immigrants from Iraq |
| Minimum | 12.7% | 3.6% |
| Maximum | 100.0% | 55.3% |
| Range | 87.3% | 51.7% |
| Mean | 41.1% | 24.1% |
| Median | 35.5% | 24.8% |
| Interquartile 25% (IQ1) | 27.5% | 14.6% |
| Interquartile 75% (IQ3) | 52.9% | 31.8% |
| Interquartile Range (IQR) | 25.4% | 17.1% |
| Standard Deviation (Sample) | 20.3% | 11.6% |
| Standard Deviation (Population) | 20.1% | 11.5% |
Similar Demographics by Births to Unmarried Women
Demographics Similar to Immigrants from Portugal by Births to Unmarried Women
In terms of births to unmarried women, the demographic groups most similar to Immigrants from Portugal are Potawatomi (36.2%, a difference of 0.22%), Chickasaw (36.3%, a difference of 0.36%), Immigrants from Trinidad and Tobago (36.3%, a difference of 0.36%), Immigrants from Grenada (36.3%, a difference of 0.39%), and Salvadoran (36.0%, a difference of 0.46%).
| Demographics | Rating | Rank | Births to Unmarried Women |
| Nigerians | 0.7 /100 | #246 | Tragic 35.3% |
| Immigrants | Nigeria | 0.7 /100 | #247 | Tragic 35.4% |
| Immigrants | Nonimmigrants | 0.6 /100 | #248 | Tragic 35.5% |
| Bermudans | 0.6 /100 | #249 | Tragic 35.5% |
| Mexican American Indians | 0.4 /100 | #250 | Tragic 35.7% |
| Immigrants | Western Africa | 0.3 /100 | #251 | Tragic 36.0% |
| Salvadorans | 0.3 /100 | #252 | Tragic 36.0% |
| Immigrants | Portugal | 0.2 /100 | #253 | Tragic 36.2% |
| Potawatomi | 0.2 /100 | #254 | Tragic 36.2% |
| Chickasaw | 0.2 /100 | #255 | Tragic 36.3% |
| Immigrants | Trinidad and Tobago | 0.2 /100 | #256 | Tragic 36.3% |
| Immigrants | Grenada | 0.2 /100 | #257 | Tragic 36.3% |
| Americans | 0.2 /100 | #258 | Tragic 36.4% |
| Immigrants | El Salvador | 0.2 /100 | #259 | Tragic 36.4% |
| Ottawa | 0.2 /100 | #260 | Tragic 36.5% |
Demographics Similar to Immigrants from Iraq by Births to Unmarried Women
In terms of births to unmarried women, the demographic groups most similar to Immigrants from Iraq are Immigrants from Russia (27.1%, a difference of 0.030%), Immigrants from Sri Lanka (27.2%, a difference of 0.10%), Immigrants from Pakistan (27.2%, a difference of 0.14%), Immigrants from Ireland (27.2%, a difference of 0.22%), and Bulgarian (27.1%, a difference of 0.29%).
| Demographics | Rating | Rank | Births to Unmarried Women |
| Immigrants | Australia | 99.9 /100 | #24 | Exceptional 26.6% |
| Cambodians | 99.9 /100 | #25 | Exceptional 26.7% |
| Asians | 99.9 /100 | #26 | Exceptional 26.8% |
| Immigrants | Asia | 99.9 /100 | #27 | Exceptional 26.8% |
| Okinawans | 99.8 /100 | #28 | Exceptional 26.9% |
| Cypriots | 99.8 /100 | #29 | Exceptional 27.0% |
| Bulgarians | 99.8 /100 | #30 | Exceptional 27.1% |
| Immigrants | Iraq | 99.8 /100 | #31 | Exceptional 27.1% |
| Immigrants | Russia | 99.8 /100 | #32 | Exceptional 27.1% |
| Immigrants | Sri Lanka | 99.8 /100 | #33 | Exceptional 27.2% |
| Immigrants | Pakistan | 99.8 /100 | #34 | Exceptional 27.2% |
| Immigrants | Ireland | 99.7 /100 | #35 | Exceptional 27.2% |
| Immigrants | Western Asia | 99.7 /100 | #36 | Exceptional 27.2% |
| Immigrants | Ukraine | 99.7 /100 | #37 | Exceptional 27.2% |
| Immigrants | Moldova | 99.7 /100 | #38 | Exceptional 27.3% |