Immigrants from Ecuador vs Immigrants from Iraq Births to Unmarried Women
COMPARE
Immigrants from Ecuador
Immigrants from Iraq
Births to Unmarried Women
Births to Unmarried Women Comparison
Immigrants from Ecuador
Immigrants from Iraq
33.7%
BIRTHS TO UNMARRIED WOMEN
5.9/ 100
METRIC RATING
218th/ 347
METRIC RANK
27.1%
BIRTHS TO UNMARRIED WOMEN
99.8/ 100
METRIC RATING
31st/ 347
METRIC RANK
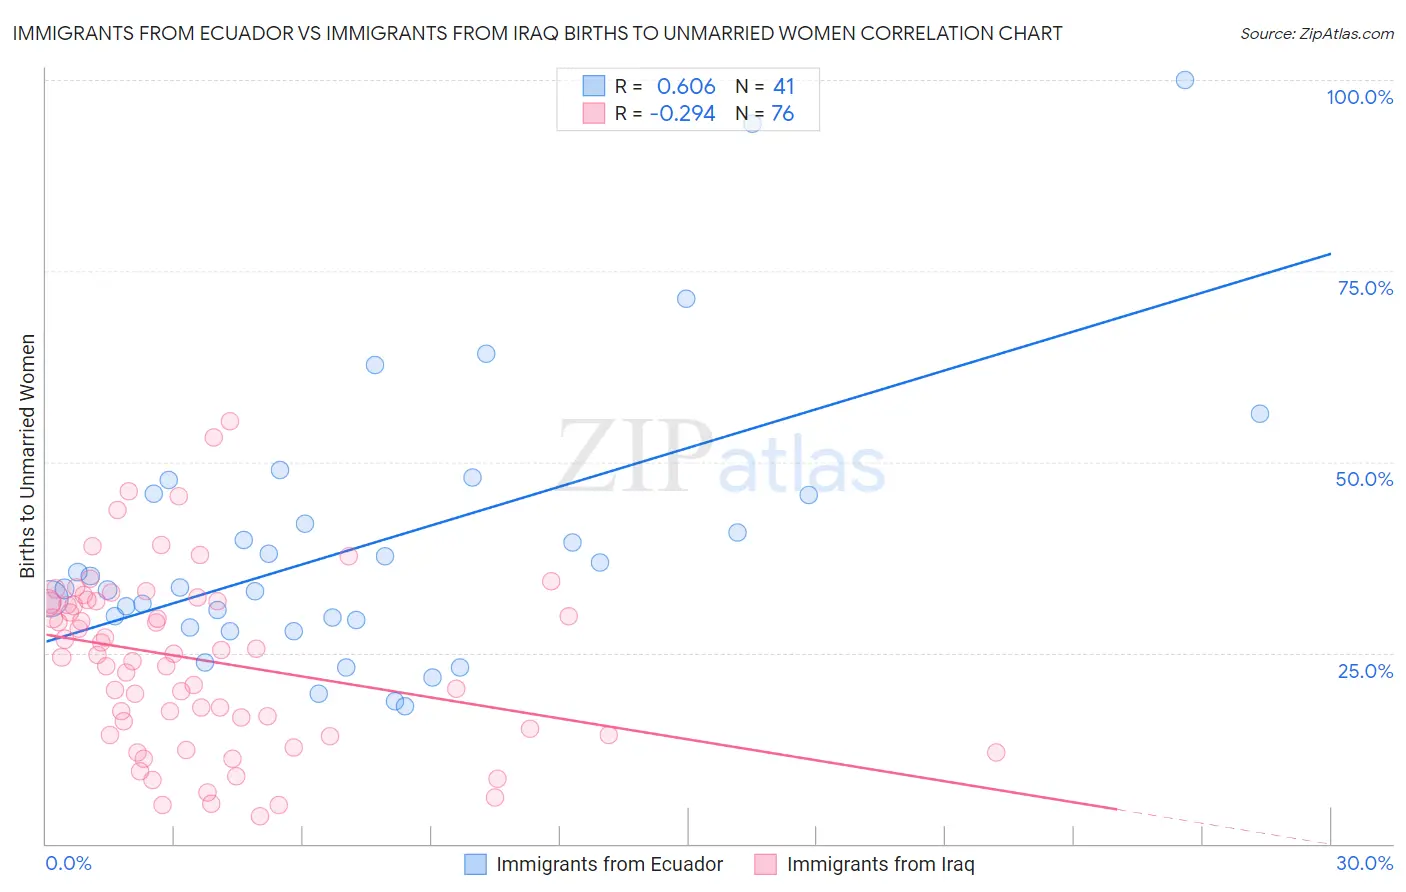
Immigrants from Ecuador vs Immigrants from Iraq Births to Unmarried Women Correlation Chart
The statistical analysis conducted on geographies consisting of 257,926,700 people shows a significant positive correlation between the proportion of Immigrants from Ecuador and percentage of births to unmarried women in the United States with a correlation coefficient (R) of 0.606 and weighted average of 33.7%. Similarly, the statistical analysis conducted on geographies consisting of 187,409,646 people shows a weak negative correlation between the proportion of Immigrants from Iraq and percentage of births to unmarried women in the United States with a correlation coefficient (R) of -0.294 and weighted average of 27.1%, a difference of 24.3%.
Births to Unmarried Women Correlation Summary
| Measurement | Immigrants from Ecuador | Immigrants from Iraq |
| Minimum | 18.0% | 3.6% |
| Maximum | 100.0% | 55.3% |
| Range | 82.0% | 51.7% |
| Mean | 39.2% | 24.1% |
| Median | 33.6% | 24.8% |
| Interquartile 25% (IQ1) | 28.8% | 14.6% |
| Interquartile 75% (IQ3) | 45.7% | 31.8% |
| Interquartile Range (IQR) | 17.0% | 17.1% |
| Standard Deviation (Sample) | 18.0% | 11.6% |
| Standard Deviation (Population) | 17.8% | 11.5% |
Similar Demographics by Births to Unmarried Women
Demographics Similar to Immigrants from Ecuador by Births to Unmarried Women
In terms of births to unmarried women, the demographic groups most similar to Immigrants from Ecuador are Alsatian (33.8%, a difference of 0.22%), Portuguese (33.8%, a difference of 0.24%), Spaniard (33.6%, a difference of 0.40%), Malaysian (33.9%, a difference of 0.41%), and Immigrants from Uruguay (33.9%, a difference of 0.48%).
| Demographics | Rating | Rank | Births to Unmarried Women |
| Ecuadorians | 10.5 /100 | #211 | Poor 33.3% |
| Celtics | 10.2 /100 | #212 | Poor 33.3% |
| Immigrants | Costa Rica | 9.5 /100 | #213 | Tragic 33.4% |
| Slovaks | 9.3 /100 | #214 | Tragic 33.4% |
| French | 8.7 /100 | #215 | Tragic 33.4% |
| Nepalese | 7.8 /100 | #216 | Tragic 33.5% |
| Spaniards | 7.0 /100 | #217 | Tragic 33.6% |
| Immigrants | Ecuador | 5.9 /100 | #218 | Tragic 33.7% |
| Alsatians | 5.4 /100 | #219 | Tragic 33.8% |
| Portuguese | 5.4 /100 | #220 | Tragic 33.8% |
| Malaysians | 5.0 /100 | #221 | Tragic 33.9% |
| Immigrants | Uruguay | 4.8 /100 | #222 | Tragic 33.9% |
| Pennsylvania Germans | 4.3 /100 | #223 | Tragic 34.0% |
| Immigrants | Laos | 4.3 /100 | #224 | Tragic 34.0% |
| Spanish | 4.0 /100 | #225 | Tragic 34.1% |
Demographics Similar to Immigrants from Iraq by Births to Unmarried Women
In terms of births to unmarried women, the demographic groups most similar to Immigrants from Iraq are Immigrants from Russia (27.1%, a difference of 0.030%), Immigrants from Sri Lanka (27.2%, a difference of 0.10%), Immigrants from Pakistan (27.2%, a difference of 0.14%), Immigrants from Ireland (27.2%, a difference of 0.22%), and Bulgarian (27.1%, a difference of 0.29%).
| Demographics | Rating | Rank | Births to Unmarried Women |
| Immigrants | Australia | 99.9 /100 | #24 | Exceptional 26.6% |
| Cambodians | 99.9 /100 | #25 | Exceptional 26.7% |
| Asians | 99.9 /100 | #26 | Exceptional 26.8% |
| Immigrants | Asia | 99.9 /100 | #27 | Exceptional 26.8% |
| Okinawans | 99.8 /100 | #28 | Exceptional 26.9% |
| Cypriots | 99.8 /100 | #29 | Exceptional 27.0% |
| Bulgarians | 99.8 /100 | #30 | Exceptional 27.1% |
| Immigrants | Iraq | 99.8 /100 | #31 | Exceptional 27.1% |
| Immigrants | Russia | 99.8 /100 | #32 | Exceptional 27.1% |
| Immigrants | Sri Lanka | 99.8 /100 | #33 | Exceptional 27.2% |
| Immigrants | Pakistan | 99.8 /100 | #34 | Exceptional 27.2% |
| Immigrants | Ireland | 99.7 /100 | #35 | Exceptional 27.2% |
| Immigrants | Western Asia | 99.7 /100 | #36 | Exceptional 27.2% |
| Immigrants | Ukraine | 99.7 /100 | #37 | Exceptional 27.2% |
| Immigrants | Moldova | 99.7 /100 | #38 | Exceptional 27.3% |