Scottish vs Immigrants from Latvia Births to Unmarried Women
COMPARE
Scottish
Immigrants from Latvia
Births to Unmarried Women
Births to Unmarried Women Comparison
Scottish
Immigrants from Latvia
31.7%
BIRTHS TO UNMARRIED WOMEN
48.1/ 100
METRIC RATING
176th/ 347
METRIC RANK
29.1%
BIRTHS TO UNMARRIED WOMEN
96.8/ 100
METRIC RATING
90th/ 347
METRIC RANK
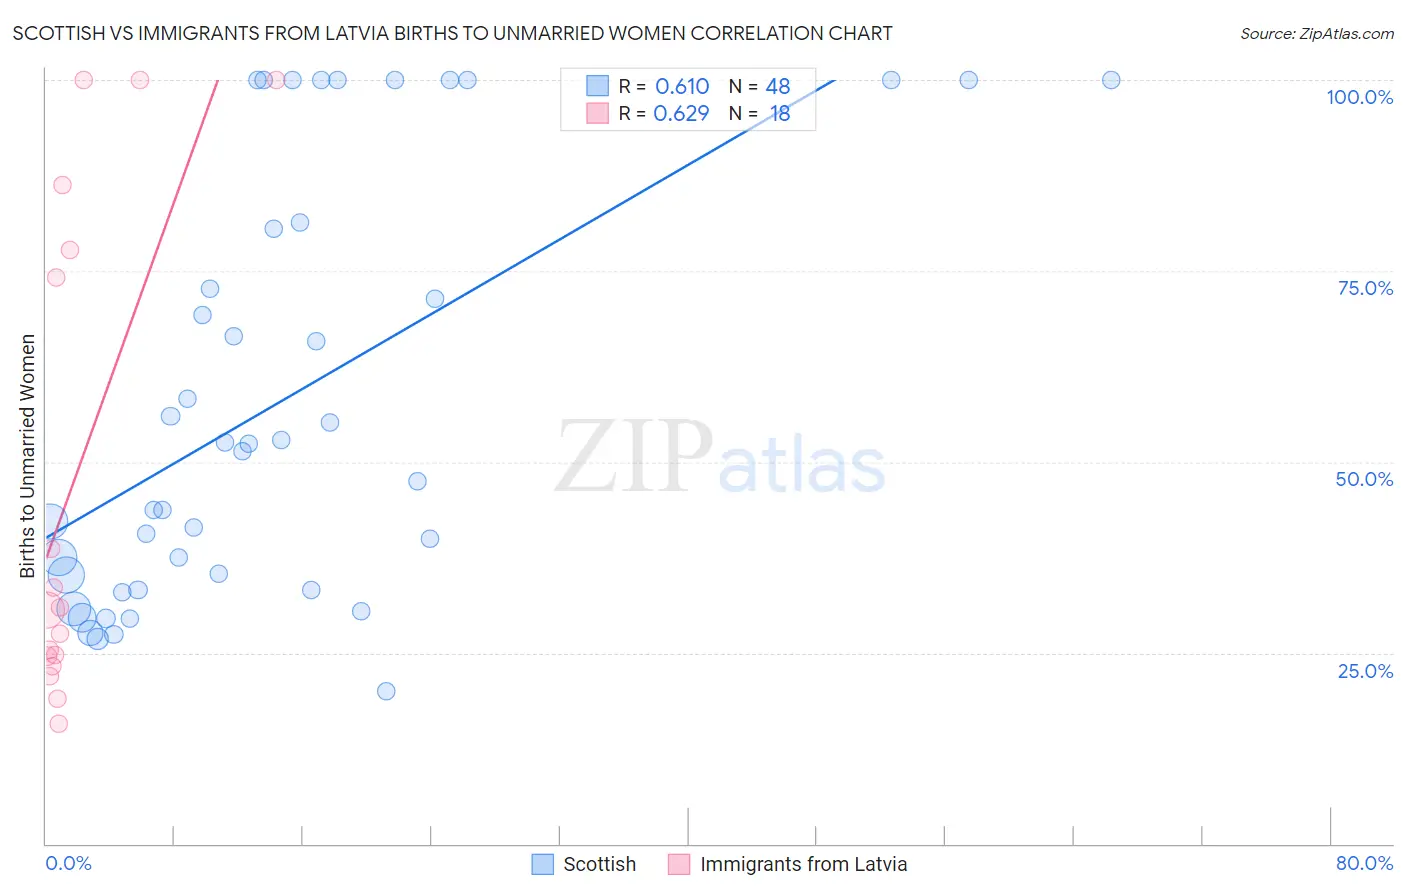
Scottish vs Immigrants from Latvia Births to Unmarried Women Correlation Chart
The statistical analysis conducted on geographies consisting of 501,775,735 people shows a significant positive correlation between the proportion of Scottish and percentage of births to unmarried women in the United States with a correlation coefficient (R) of 0.610 and weighted average of 31.7%. Similarly, the statistical analysis conducted on geographies consisting of 109,179,125 people shows a significant positive correlation between the proportion of Immigrants from Latvia and percentage of births to unmarried women in the United States with a correlation coefficient (R) of 0.629 and weighted average of 29.1%, a difference of 9.0%.
Births to Unmarried Women Correlation Summary
| Measurement | Scottish | Immigrants from Latvia |
| Minimum | 20.0% | 15.8% |
| Maximum | 100.0% | 100.0% |
| Range | 80.0% | 84.2% |
| Mean | 58.0% | 47.4% |
| Median | 51.9% | 30.8% |
| Interquartile 25% (IQ1) | 34.3% | 24.5% |
| Interquartile 75% (IQ3) | 80.9% | 77.8% |
| Interquartile Range (IQR) | 46.7% | 53.3% |
| Standard Deviation (Sample) | 27.2% | 31.8% |
| Standard Deviation (Population) | 26.9% | 30.9% |
Similar Demographics by Births to Unmarried Women
Demographics Similar to Scottish by Births to Unmarried Women
In terms of births to unmarried women, the demographic groups most similar to Scottish are South American Indian (31.7%, a difference of 0.040%), English (31.7%, a difference of 0.070%), Immigrants from Venezuela (31.7%, a difference of 0.10%), South American (31.8%, a difference of 0.11%), and Venezuelan (31.7%, a difference of 0.18%).
| Demographics | Rating | Rank | Births to Unmarried Women |
| Slavs | 52.0 /100 | #169 | Average 31.6% |
| Guamanians/Chamorros | 51.3 /100 | #170 | Average 31.6% |
| Finns | 50.5 /100 | #171 | Average 31.7% |
| Immigrants | Eritrea | 50.4 /100 | #172 | Average 31.7% |
| Immigrants | Yemen | 50.2 /100 | #173 | Average 31.7% |
| Venezuelans | 50.0 /100 | #174 | Average 31.7% |
| Immigrants | Venezuela | 49.2 /100 | #175 | Average 31.7% |
| Scottish | 48.1 /100 | #176 | Average 31.7% |
| South American Indians | 47.7 /100 | #177 | Average 31.7% |
| English | 47.4 /100 | #178 | Average 31.7% |
| South Americans | 46.9 /100 | #179 | Average 31.8% |
| Moroccans | 45.7 /100 | #180 | Average 31.8% |
| Immigrants | Peru | 45.1 /100 | #181 | Average 31.8% |
| Kenyans | 43.0 /100 | #182 | Average 31.9% |
| Canadians | 41.4 /100 | #183 | Average 31.9% |
Demographics Similar to Immigrants from Latvia by Births to Unmarried Women
In terms of births to unmarried women, the demographic groups most similar to Immigrants from Latvia are Immigrants from Saudi Arabia (29.1%, a difference of 0.16%), Immigrants from Fiji (29.2%, a difference of 0.21%), Arab (29.2%, a difference of 0.25%), Estonian (29.2%, a difference of 0.29%), and Ukrainian (29.2%, a difference of 0.41%).
| Demographics | Rating | Rank | Births to Unmarried Women |
| Immigrants | Kuwait | 98.0 /100 | #83 | Exceptional 28.8% |
| Immigrants | Poland | 97.6 /100 | #84 | Exceptional 28.9% |
| Sri Lankans | 97.5 /100 | #85 | Exceptional 28.9% |
| Immigrants | Jordan | 97.4 /100 | #86 | Exceptional 29.0% |
| Taiwanese | 97.3 /100 | #87 | Exceptional 29.0% |
| Immigrants | France | 97.3 /100 | #88 | Exceptional 29.0% |
| Immigrants | Saudi Arabia | 97.0 /100 | #89 | Exceptional 29.1% |
| Immigrants | Latvia | 96.8 /100 | #90 | Exceptional 29.1% |
| Immigrants | Fiji | 96.6 /100 | #91 | Exceptional 29.2% |
| Arabs | 96.5 /100 | #92 | Exceptional 29.2% |
| Estonians | 96.5 /100 | #93 | Exceptional 29.2% |
| Ukrainians | 96.3 /100 | #94 | Exceptional 29.2% |
| Immigrants | Vietnam | 96.1 /100 | #95 | Exceptional 29.3% |
| Norwegians | 95.8 /100 | #96 | Exceptional 29.3% |
| Immigrants | South Africa | 95.7 /100 | #97 | Exceptional 29.3% |