Sioux vs South American Divorced or Separated
COMPARE
Sioux
South American
Divorced or Separated
Divorced or Separated Comparison
Sioux
South Americans
13.2%
DIVORCED OR SEPARATED
0.0/ 100
METRIC RATING
311th/ 347
METRIC RANK
12.2%
DIVORCED OR SEPARATED
28.6/ 100
METRIC RATING
200th/ 347
METRIC RANK
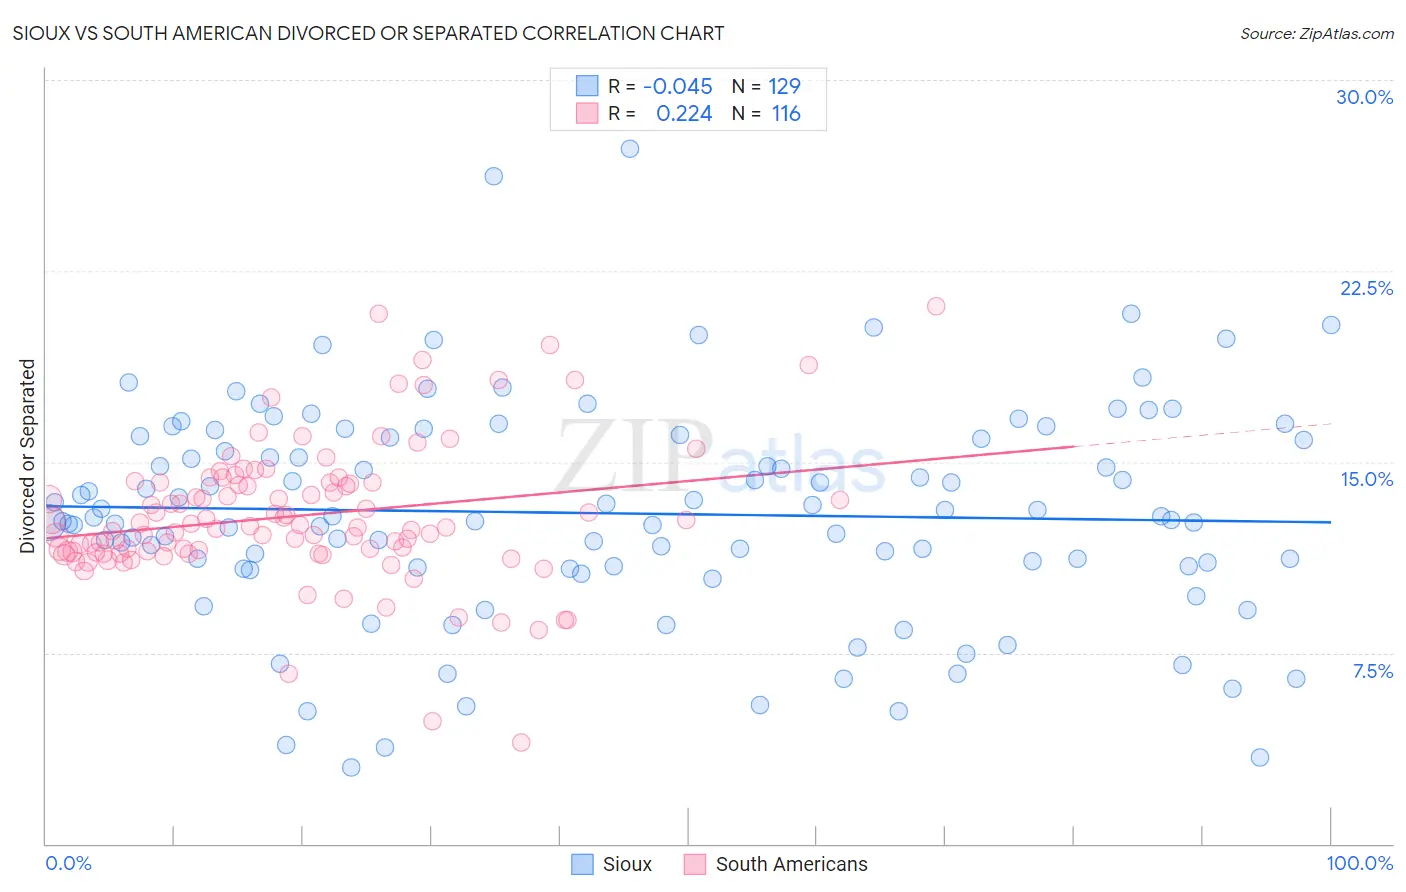
Sioux vs South American Divorced or Separated Correlation Chart
The statistical analysis conducted on geographies consisting of 234,160,973 people shows no correlation between the proportion of Sioux and percentage of population currently divorced or separated in the United States with a correlation coefficient (R) of -0.045 and weighted average of 13.2%. Similarly, the statistical analysis conducted on geographies consisting of 493,837,840 people shows a weak positive correlation between the proportion of South Americans and percentage of population currently divorced or separated in the United States with a correlation coefficient (R) of 0.224 and weighted average of 12.2%, a difference of 8.9%.
Divorced or Separated Correlation Summary
| Measurement | Sioux | South American |
| Minimum | 3.0% | 4.0% |
| Maximum | 27.3% | 21.1% |
| Range | 24.3% | 17.1% |
| Mean | 13.0% | 12.9% |
| Median | 12.8% | 12.5% |
| Interquartile 25% (IQ1) | 10.9% | 11.4% |
| Interquartile 75% (IQ3) | 16.0% | 14.2% |
| Interquartile Range (IQR) | 5.1% | 2.7% |
| Standard Deviation (Sample) | 4.3% | 2.8% |
| Standard Deviation (Population) | 4.3% | 2.7% |
Similar Demographics by Divorced or Separated
Demographics Similar to Sioux by Divorced or Separated
In terms of divorced or separated, the demographic groups most similar to Sioux are African (13.2%, a difference of 0.020%), American (13.2%, a difference of 0.040%), Ottawa (13.2%, a difference of 0.050%), French American Indian (13.2%, a difference of 0.14%), and Blackfeet (13.3%, a difference of 0.35%).
| Demographics | Rating | Rank | Divorced or Separated |
| Hopi | 0.0 /100 | #304 | Tragic 13.2% |
| Chippewa | 0.0 /100 | #305 | Tragic 13.2% |
| Tlingit-Haida | 0.0 /100 | #306 | Tragic 13.2% |
| French American Indians | 0.0 /100 | #307 | Tragic 13.2% |
| Ottawa | 0.0 /100 | #308 | Tragic 13.2% |
| Americans | 0.0 /100 | #309 | Tragic 13.2% |
| Africans | 0.0 /100 | #310 | Tragic 13.2% |
| Sioux | 0.0 /100 | #311 | Tragic 13.2% |
| Blackfeet | 0.0 /100 | #312 | Tragic 13.3% |
| Immigrants | Nicaragua | 0.0 /100 | #313 | Tragic 13.3% |
| Yaqui | 0.0 /100 | #314 | Tragic 13.3% |
| Spanish Americans | 0.0 /100 | #315 | Tragic 13.3% |
| Tsimshian | 0.0 /100 | #316 | Tragic 13.3% |
| Haitians | 0.0 /100 | #317 | Tragic 13.3% |
| Cree | 0.0 /100 | #318 | Tragic 13.4% |
Demographics Similar to South Americans by Divorced or Separated
In terms of divorced or separated, the demographic groups most similar to South Americans are Central American (12.1%, a difference of 0.030%), Nigerian (12.1%, a difference of 0.060%), Immigrants from Burma/Myanmar (12.1%, a difference of 0.070%), Immigrants from Africa (12.1%, a difference of 0.070%), and Guatemalan (12.2%, a difference of 0.070%).
| Demographics | Rating | Rank | Divorced or Separated |
| Immigrants | Thailand | 32.5 /100 | #193 | Fair 12.1% |
| Immigrants | Eritrea | 31.9 /100 | #194 | Fair 12.1% |
| Immigrants | England | 31.4 /100 | #195 | Fair 12.1% |
| Immigrants | Burma/Myanmar | 30.4 /100 | #196 | Fair 12.1% |
| Immigrants | Africa | 30.3 /100 | #197 | Fair 12.1% |
| Nigerians | 30.1 /100 | #198 | Fair 12.1% |
| Central Americans | 29.4 /100 | #199 | Fair 12.1% |
| South Americans | 28.6 /100 | #200 | Fair 12.2% |
| Guatemalans | 26.9 /100 | #201 | Fair 12.2% |
| Portuguese | 23.5 /100 | #202 | Fair 12.2% |
| Immigrants | Guatemala | 23.2 /100 | #203 | Fair 12.2% |
| Kenyans | 21.8 /100 | #204 | Fair 12.2% |
| Immigrants | Costa Rica | 21.3 /100 | #205 | Fair 12.2% |
| Slovaks | 21.0 /100 | #206 | Fair 12.2% |
| Mexicans | 21.0 /100 | #207 | Fair 12.2% |