Serbian vs Immigrants from Eastern Africa Married-couple Households
COMPARE
Serbian
Immigrants from Eastern Africa
Married-couple Households
Married-couple Households Comparison
Serbians
Immigrants from Eastern Africa
47.0%
MARRIED-COUPLE HOUSEHOLDS
76.3/ 100
METRIC RATING
152nd/ 347
METRIC RANK
42.9%
MARRIED-COUPLE HOUSEHOLDS
0.0/ 100
METRIC RATING
277th/ 347
METRIC RANK
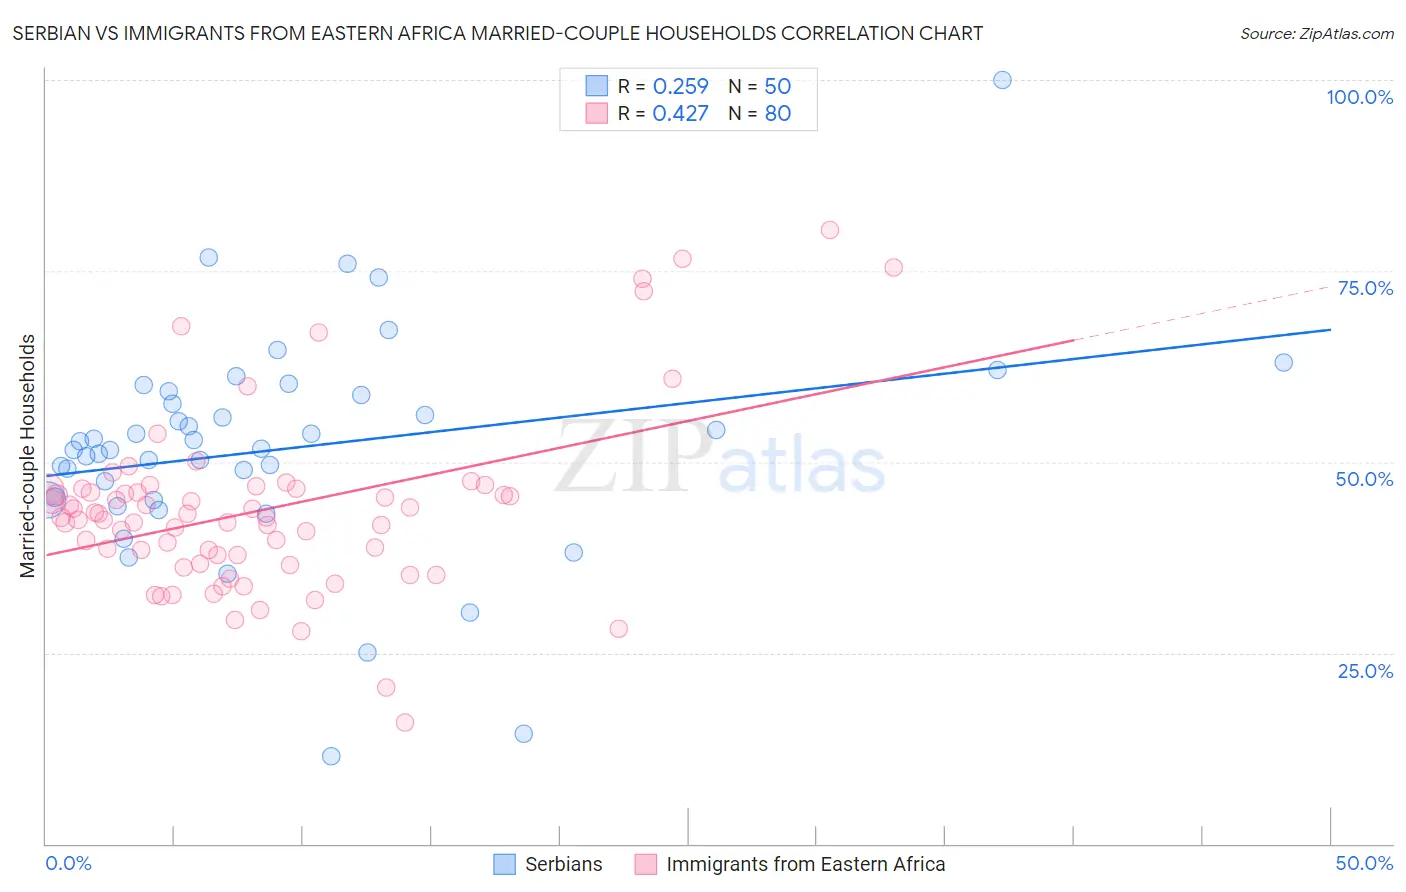
Serbian vs Immigrants from Eastern Africa Married-couple Households Correlation Chart
The statistical analysis conducted on geographies consisting of 267,530,139 people shows a weak positive correlation between the proportion of Serbians and percentage of married-couple family households in the United States with a correlation coefficient (R) of 0.259 and weighted average of 47.0%. Similarly, the statistical analysis conducted on geographies consisting of 354,884,071 people shows a moderate positive correlation between the proportion of Immigrants from Eastern Africa and percentage of married-couple family households in the United States with a correlation coefficient (R) of 0.427 and weighted average of 42.9%, a difference of 9.3%.
Married-couple Households Correlation Summary
| Measurement | Serbian | Immigrants from Eastern Africa |
| Minimum | 11.4% | 15.8% |
| Maximum | 100.0% | 80.4% |
| Range | 88.6% | 64.5% |
| Mean | 51.7% | 43.7% |
| Median | 51.7% | 42.7% |
| Interquartile 25% (IQ1) | 45.0% | 37.2% |
| Interquartile 75% (IQ3) | 58.7% | 46.4% |
| Interquartile Range (IQR) | 13.7% | 9.2% |
| Standard Deviation (Sample) | 14.6% | 11.8% |
| Standard Deviation (Population) | 14.5% | 11.7% |
Similar Demographics by Married-couple Households
Demographics Similar to Serbians by Married-couple Households
In terms of married-couple households, the demographic groups most similar to Serbians are Hmong (47.0%, a difference of 0.010%), Immigrants from Western Asia (46.9%, a difference of 0.010%), Immigrants from Bulgaria (47.0%, a difference of 0.020%), Arab (46.9%, a difference of 0.020%), and Armenian (46.9%, a difference of 0.050%).
| Demographics | Rating | Rank | Married-couple Households |
| Slovenes | 81.7 /100 | #145 | Excellent 47.1% |
| Immigrants | Western Europe | 81.6 /100 | #146 | Excellent 47.1% |
| Immigrants | Syria | 81.6 /100 | #147 | Excellent 47.1% |
| Icelanders | 79.5 /100 | #148 | Good 47.0% |
| Paraguayans | 78.7 /100 | #149 | Good 47.0% |
| Immigrants | Russia | 77.6 /100 | #150 | Good 47.0% |
| Immigrants | Bulgaria | 76.8 /100 | #151 | Good 47.0% |
| Serbians | 76.3 /100 | #152 | Good 47.0% |
| Hmong | 76.2 /100 | #153 | Good 47.0% |
| Immigrants | Western Asia | 76.1 /100 | #154 | Good 46.9% |
| Arabs | 76.0 /100 | #155 | Good 46.9% |
| Armenians | 75.4 /100 | #156 | Good 46.9% |
| Immigrants | Oceania | 74.8 /100 | #157 | Good 46.9% |
| Immigrants | Nonimmigrants | 73.3 /100 | #158 | Good 46.9% |
| Osage | 73.2 /100 | #159 | Good 46.9% |
Demographics Similar to Immigrants from Eastern Africa by Married-couple Households
In terms of married-couple households, the demographic groups most similar to Immigrants from Eastern Africa are Immigrants from Africa (42.9%, a difference of 0.11%), Sierra Leonean (42.9%, a difference of 0.14%), Immigrants from Ecuador (42.9%, a difference of 0.19%), Immigrants from Ethiopia (43.1%, a difference of 0.26%), and Immigrants from Guatemala (42.8%, a difference of 0.26%).
| Demographics | Rating | Rank | Married-couple Households |
| Yuman | 0.1 /100 | #270 | Tragic 43.3% |
| Guatemalans | 0.1 /100 | #271 | Tragic 43.3% |
| Immigrants | Nigeria | 0.1 /100 | #272 | Tragic 43.2% |
| Ethiopians | 0.1 /100 | #273 | Tragic 43.2% |
| Nigerians | 0.1 /100 | #274 | Tragic 43.2% |
| Immigrants | Bangladesh | 0.0 /100 | #275 | Tragic 43.1% |
| Immigrants | Ethiopia | 0.0 /100 | #276 | Tragic 43.1% |
| Immigrants | Eastern Africa | 0.0 /100 | #277 | Tragic 42.9% |
| Immigrants | Africa | 0.0 /100 | #278 | Tragic 42.9% |
| Sierra Leoneans | 0.0 /100 | #279 | Tragic 42.9% |
| Immigrants | Ecuador | 0.0 /100 | #280 | Tragic 42.9% |
| Immigrants | Guatemala | 0.0 /100 | #281 | Tragic 42.8% |
| Bermudans | 0.0 /100 | #282 | Tragic 42.4% |
| Inupiat | 0.0 /100 | #283 | Tragic 42.4% |
| Cheyenne | 0.0 /100 | #284 | Tragic 42.3% |